
www.cs.ubc.ca/~tmm/courses/journ17
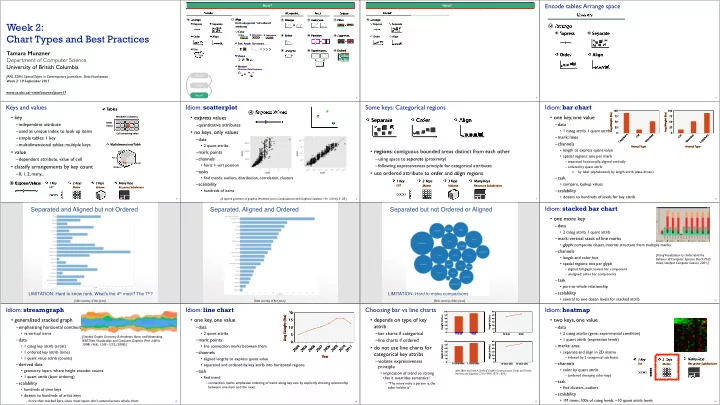
Week 2: Chart Types and Best Practices
Tamara Munzner Department of Computer Science University of British Columbia
JRNL 520H, Special Topics in Contemporary Journalism: Data Visualization Week 2: 19 September 2017
2
Encode Arrange Express Separate Order Align Use Manipulate Facet Reduce Change Select Navigate Juxtapose Partition Superimpose Filter Aggregate Embed
How? Encode Manipulate Facet
Map Color Motion Size, Angle, Curvature, ...
Hue Saturation Luminance
Shape
Direction, Rate, Frequency, ...
from categorical and ordered attributes
3
Encode Arrange Express Separate Order Align
How? Encode Manipulate Facet
4
Encode Arrange Express Separate Order Align
Encode tables: Arrange space
5
Keys and values
- key
–independent attribute –used as unique index to look up items –simple tables: 1 key –multidimensional tables: multiple keys
- value
–dependent attribute, value of cell
- classify arrangements by key count
–0, 1, 2, many...
1 Key 2 Keys 3 Keys Many Keys
List Recursive Subdivision Volume Matrix
Express Values Tables
Attributes (columns) Items (rows) Cell containing value
Multidimensional Table
Value in cell
Idiom: scatterplot
- express values
–quantitative attributes
- no keys, only values
–data
- 2 quant attribs
–mark: points –channels
- horiz + vert position
–tasks
- find trends, outliers, distribution, correlation, clusters
–scalability
- hundreds of items
6
[A layered grammar of graphics.
- Wickham. Journ. Computational and Graphical Statistics 19:1 (2010), 3–28.]
Express Values
Some keys: Categorical regions
- regions: contiguous bounded areas distinct from each other
–using space to separate (proximity) –following expressiveness principle for categorical attributes
- use ordered attribute to order and align regions
7
1 Key 2 Keys 3 Keys Many Keys
List Recursive Subdivision Volume Matrix
Separate Order Align
Idiom: bar chart
- one key, one value
–data
- 1 categ attrib, 1 quant attrib
–mark: lines –channels
- length to express quant value
- spatial regions: one per mark
– separated horizontally, aligned vertically – ordered by quant attrib » by label (alphabetical), by length attrib (data-driven)
–task
- compare, lookup values
–scalability
- dozens to hundreds of levels for key attrib
8
100 75 50 25 Animal Type 100 75 50 25 Animal Type
Separated and Aligned but not Ordered
LIMITATION: Hard to know rank. What’s the 4th most? The 7th?
[Slide courtesy of Ben Jones]
Separated, Aligned and Ordered
[Slide courtesy of Ben Jones]
Separated but not Ordered or Aligned
LIMITATION: Hard to make comparisons
[Slide courtesy of Ben Jones]
Idiom: stacked bar chart
- one more key
–data
- 2 categ attrib, 1 quant attrib
–mark: vertical stack of line marks
- glyph: composite object, internal structure from multiple marks
–channels
- length and color hue
- spatial regions: one per glyph
– aligned: full glyph, lowest bar component – unaligned: other bar components
–task
- part-to-whole relationship
–scalability
- several to one dozen levels for stacked attrib
12
[Using Visualization to Understand the Behavior of Computer Systems. Bosch. Ph.D. thesis, Stanford Computer Science, 2001.]
Idiom: streamgraph
- generalized stacked graph
–emphasizing horizontal continuity
- vs vertical items
–data
- 1 categ key attrib (artist)
- 1 ordered key attrib (time)
- 1 quant value attrib (counts)
–derived data
- geometry: layers, where height encodes counts
- 1 quant attrib (layer ordering)
–scalability
- hundreds of time keys
- dozens to hundreds of artist keys
– more than stacked bars, since most layers don’t extend across whole chart
13
[Stacked Graphs Geometry & Aesthetics. Byron and Wattenberg. IEEE Trans. Visualization and Computer Graphics (Proc. InfoVis 2008) 14(6): 1245–1252, (2008).]
Idiom: line chart
- one key, one value
–data
- 2 quant attribs
–mark: points
- line connection marks between them
–channels
- aligned lengths to express quant value
- separated and ordered by key attrib into horizontal regions
–task
- find trend
– connection marks emphasize ordering of items along key axis by explicitly showing relationship between one item and the next
14
20 15 10 5 Year
Choosing bar vs line charts
- depends on type of key
attrib
–bar charts if categorical –line charts if ordered
- do not use line charts for
categorical key attribs
–violates expressiveness principle
- implication of trend so strong
that it overrides semantics!
– “The more male a person is, the taller he/she is”
15
after [Bars and Lines: A Study of Graphic Communication. Zacks and Tversky. Memory and Cognition 27:6 (1999), 1073–1079.]
Female Male
60 50 40 30 20 10
Female Male
60 50 40 30 20 10
10-year-olds 12-year-olds
60 50 40 30 20 10 60 50 40 30 20 10
10-year-olds 12-year-olds
Idiom: heatmap
- two keys, one value
–data
- 2 categ attribs (gene, experimental condition)
- 1 quant attrib (expression levels)
–marks: area
- separate and align in 2D matrix
– indexed by 2 categorical attributes
–channels
- color by quant attrib
– (ordered diverging colormap)
–task
- find clusters, outliers
–scalability
- 1M items, 100s of categ levels, ~10 quant attrib levels
16
1 Key 2 Keys
List Matrix
Many Keys
Recursive Subdivision