Lectures 3&4: from categorical and ordered Express Separate - - PowerPoint PPT Presentation

lectures 3 4
SMART_READER_LITE
LIVE PREVIEW

Lectures 3&4: from categorical and ordered Express Separate - - PowerPoint PPT Presentation

How to handle complexity: 1 previous strategy + 3 more Facet How? Encode Manipulate Facet Encode Manipulate Facet Reduce Juxtapose Manipulate Facet Reduce Map Derive Arrange Change Juxtapose Filter Lectures 3&4: from


slide-1
SLIDE 1

https://github.ubc.ca/ubc-mds-2016/DSCI_532_viz-2_students

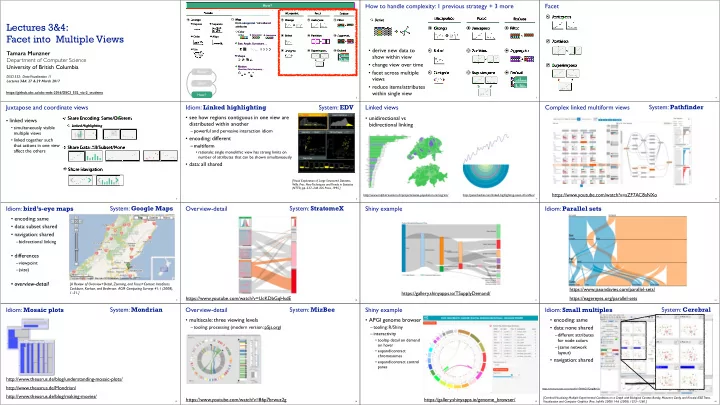
Lectures 3&4: 
 Facet into Multiple Views

Tamara Munzner Department of Computer Science University of British Columbia

DSCI 532: Data Visualization 1I Lectures 3&4: 27 & 29 March 2017

2

Encode Arrange Express Separate Order Align Use Manipulate Facet Reduce Change Select Navigate Juxtapose Partition Superimpose Filter Aggregate Embed

How? Encode Manipulate Facet

Map Color Motion Size, Angle, Curvature, ...

Hue Saturation Luminance

Shape

Direction, Rate, Frequency, ...

from categorical and ordered attributes

How to handle complexity: 1 previous strategy + 3 more

3

Manipulate Facet Reduce Change Select Navigate Juxtapose Partition Superimpose Filter Aggregate Embed Derive

  • derive new data to

show within view

  • change view over time
  • facet across multiple

views

  • reduce items/attributes

within single view

Facet

4

Juxtapose Partition Superimpose

Juxtapose and coordinate views

  • linked views
  • simultaneously visible

multiple views

  • linked together such

that actions in one view affect the others

5

Share Encoding: Same/Difgerent Share Data: All/Subset/None Share Navigation

Linked Highlighting

Idiom: Linked highlighting

6

System: EDV

  • see how regions contiguous in one view are

distributed within another

–powerful and pervasive interaction idiom

  • encoding: different

–multiform

  • rationale: single monolithic view has strong limits on

number of attributes that can be shown simultaneously

  • data: all shared

[Visual Exploration of Large Structured Datasets.

  • Wills. Proc. New

Techniques and Trends in Statistics (NTTS), pp. 237–246. IOS Press, 1995.]

Linked views

  • unidirectional vs

bidirectional linking

7

http://www.ralphstraumann.ch/projects/swiss-population-cartogram/ http://peterbeshai.com/linked-highlighting-react-d3-reflux/

Complex linked multiform views

https://www.youtube.com/watch?v=aZF7AC8aNXo

8

System: Pathfinder Idiom: bird’s-eye maps

9

  • encoding: same
  • data: subset shared
  • navigation: shared

–bidirectional linking

  • differences

–viewpoint –(size)

  • overview-detail

System: Google Maps

[A Review of Overview+Detail, Zooming, and Focus+Context Interfaces. Cockburn, Karlson, and Bederson. ACM Computing Surveys 41:1 (2008), 1–31.]

Overview-detail

10

https://www.youtube.com/watch?v=UcKDbGqHsdE

System: StratomeX Shiny example

11

https://gallery.shinyapps.io/TSupplyDemand/

Idiom: Parallel sets

12

https://www.jasondavies.com/parallel-sets/ https://eagereyes.org/parallel-sets

Idiom: Mosaic plots

13

http://www.theusrus.de/blog/making-movies/

System: Mondrian

http://www.theusrus.de/Mondrian/ http://www.theusrus.de/blog/understanding-mosaic-plots/

Overview-detail

  • multiscale: three viewing levels

–tooling: processing (modern version: p5js.org)

14

System: MizBee

https://www.youtube.com/watch?v=86p7brwuz2g

Shiny example

  • APGI genome browser

–tooling: R/Shiny –interactivity

  • tooltip detail on demand
  • n hover
  • expand/contract

chromosomes

  • expand/contract control

panes

15

https://gallery.shinyapps.io/genome_browser/

Idiom: Small multiples

  • encoding: same
  • data: none shared

–different attributes for node colors –(same network layout)

  • navigation: shared

16

System: Cerebral

[Cerebral: Visualizing Multiple Experimental Conditions on a Graph with Biological Context. Barsky, Munzner, Gardy, and Kincaid. IEEE Trans. Visualization and Computer Graphics (Proc. InfoVis 2008) 14:6 (2008), 1253–1260.]

https://www.youtube.com/watch?v=76HhG1FQngI&t=2s

slide-2
SLIDE 2

Coordinate views: Design choice interaction

17

All Subset Same Multiform Multiform, Overview/ Detail None Redundant No Linkage Small Multiples Overview/ Detail

  • why juxtapose views?

–benefits: eyes vs memory

  • lower cognitive load to move eyes between 2 views than remembering previous state with

single changing view

–costs: display area, 2 views side by side each have only half the area of one view

18

Why not animation?

  • disparate frames and

regions: comparison difficult

–vs contiguous frames –vs small region –vs coherent motion of group

  • safe special case

–animated transitions

System: Improvise

19

[Building Highly-Coordinated Visualizations In Improvise.

  • Weaver. Proc. IEEE Symp. Information

Visualization (InfoVis), pp. 159–166, 2004.]

  • investigate power
  • f multiple views

–pushing limits on view count, interaction complexity –how many is ok?

  • open research

question

–reorderable lists

  • easy lookup
  • useful when linked to
  • ther encodings

Video: Visual Analysis of Historical Hotel Visitation Patterns

20

http://www.cs.ou.edu/~weaver/improvise/examples/hotels/ https://www.youtube.com/watch?v=Tzsv6wkZoiQ

Partition into views

21

  • how to divide data between views

–split into regions by attributes –encodes association between items using spatial proximity –order of splits has major implications for what patterns are visible

  • no strict dividing line

–view: big/detailed

  • contiguous region in which visually

encoded data is shown on the display

–glyph: small/iconic

  • object with internal structure that arises

from multiple marks

Partition into Side-by-Side Views

Partitioning: List alignment

  • single bar chart with grouped bars

–split by state into regions

  • complex glyph within each region showing all

ages

–compare: easy within state, hard across ages

  • small-multiple bar charts

–split by age into regions

  • one chart per region

–compare: easy within age, harder across states

22

11.0 10.0 9.0 8.0 7.0 6.0 5.0 4.0 3.0 2.0 1.0 0.0 CA TK NY FL IL PA 65 Years and Over 45 to 64 Years 25 to 44 Years 18 to 24 Years 14 to 17 Years 5 to 13 Years Under 5 Years CA TK NY FL IL PA

5 11 5 11 5 11 5 11 5 11 5 11 5 11

Idiom: Trellis plots

  • matrix alignment for small multiple plots

–same issues as alignment for marks within plot!

  • partition by

–year for columns –site for rows (alphabetical)

  • within pane

–variety for vertical axis –yield for vertical position

23

Idiom: Trellis plots

  • main effects ordering

–order small-multiples plots based on derived data to see trends –order plots by median values –shared vertical axis within each plot ordered by median values within varieties

24

Partitioning: Recursive subdivision

  • split by neighborhood
  • then by type
  • then time

–years as rows –months as columns

  • color by price
  • neighborhood patterns

–where it’s expensive –where you pay much more for detached type

25

[Configuring Hierarchical Layouts to Address Research Questions. Slingsby, Dykes, and

  • Wood. IEEE

Transactions on Visualization and Computer Graphics (Proc. InfoVis 2009) 15:6 (2009), 977–984.]

System: HIVE Partitioning: Recursive subdivision

  • switch order of splits

–type then neighborhood

  • switch color

–by price variation

  • type patterns

–within specific type, which neighborhoods inconsistent

26

[Configuring Hierarchical Layouts to Address Research Questions. Slingsby, Dykes, and

  • Wood. IEEE

Transactions on Visualization and Computer Graphics (Proc. InfoVis 2009) 15:6 (2009), 977–984.]

System: HIVE Partitioning: Recursive subdivision

  • different encoding for

second-level regions

–choropleth maps

27

[Configuring Hierarchical Layouts to Address Research Questions. Slingsby, Dykes, and

  • Wood. IEEE

Transactions on Visualization and Computer Graphics (Proc. InfoVis 2009) 15:6 (2009), 977–984.]

System: HIVE Partitioning: Recursive subdivision

  • size regions by sale

counts

–not uniformly

  • result: treemap

28

[Configuring Hierarchical Layouts to Address Research Questions. Slingsby, Dykes, and

  • Wood. IEEE

Transactions on Visualization and Computer Graphics (Proc. InfoVis 2009) 15:6 (2009), 977–984.]

System: HIVE Superimpose layers

29

  • layer: set of objects spread out over region

–each set is visually distinguishable group –extent: whole view

  • design choices

–how many layers, how to distinguish?

  • encode with different, nonoverlapping channels
  • two layers achieveable, three with careful design

–small static set, or dynamic from many possible? Superimpose Layers

Static visual layering

  • foreground layer: roads

–hue, size distinguishing main from minor –high luminance contrast from background

  • background layer: regions

–desaturated colors for water, parks, land areas

  • user can selectively focus attention
  • “get it right in black and white”

–check luminance contrast with greyscale view

30

[Get it right in black and white. Stone. 2010. 
 http://www.stonesc.com/wordpress/2010/03/get-it-right-in-black-and-white]

Idiom: Trellis plots

  • superimpose within same frame

–color code by year

31

Superimposing limits

  • few layers, but many lines

–up to a few dozen –but not hundreds

  • superimpose vs juxtapose: empirical study

–superimposed for local, multiple for global –tasks

  • local: maximum, global: slope, discrimination

–same screen space for all multiples vs single superimposed

32

[Graphical Perception of Multiple Time Series. Javed, McDonnel, and Elmqvist. IEEE Transactions

  • n

Visualization and Computer Graphics (Proc. IEEE InfoVis 2010) 16:6 (2010), 927–934.]

CPU utilization over time 100 80 60 40 20 05:00 05:30 06:00 06:30 07:00 07:30 08:00 05:00 05:30 06:00 06:30 07:00 07:30 08:00 100 80 60 40 20 05:00 05:30 06:00 06:30 07:00 07:30 08:00 100 80 60 40 20

slide-3
SLIDE 3

Dynamic visual layering

  • interactive, from

selection

–lightweight: click –very lightweight: hover

  • ex: 1-hop neighbors

33

System: Cerebral

[Cerebral: a Cytoscape plugin for layout of and interaction with biological networks using subcellular localization annotation. Barsky, Gardy, Hancock, and

  • Munzner. Bioinformatics 23:8 (2007), 1040–1042.]

Dynamic visual layering

  • one-hop neighbour highlighting demos: click vs hover

34

http://mariandoerk.de/edgemaps/demo/ http://mbostock.github.io/d3/talk/20111116/airports.html

Further reading

  • Visualization Analysis and Design. Munzner. AK Peters

Visualization Series, CRC Press, 2014.

–Chap 12: Facet Into Multiple Views

  • A Review of Overview+Detail, Zooming, and Focus+Context Interfaces. Cockburn, Karlson, and Bederson. ACM Computing Surveys

41:1 (2008), 1–31.

  • A Guide to

Visual Multi-Level Interface Design From Synthesis of Empirical Study Evidence. Lam and Munzner. Synthesis Lectures on Visualization Series, Morgan Claypool, 2010.

  • Zooming versus multiple window interfaces: Cognitive costs of visual comparisons. Plumlee and Ware. ACM Trans. on Computer-

Human Interaction (ToCHI) 13:2 (2006), 179–209.

  • Exploring the Design Space of Composite
  • Visualization. Javed and Elmqvist. Proc. Pacific

Visualization Symp. (PacificVis), pp. 1–9, 2012.

  • Visual Comparison for Information
  • Visualization. Gleicher, Albers, Walker, Jusufi, Hansen, and Roberts. Information

Visualization 10:4 (2011), 289–309.

  • Guidelines for Using Multiple

Views in Information

  • Visualizations. Baldonado, Woodruff, and Kuchinsky. In Proc. ACM Advanced

Visual Interfaces (AVI), pp. 110–119, 2000.

  • Cross-Filtered

Views for Multidimensional Visual Analysis. Weaver. IEEE Trans. Visualization and Computer Graphics 16:2 (Proc. InfoVis 2010), 192–204, 2010.

  • Linked Data
  • Views. Wills. In Handbook of Data

Visualization, Computational Statistics, edited by Unwin, Chen, and Härdle, pp. 216–

  • 241. Springer-Verlag, 2008.
  • Glyph-based

Visualization: Foundations, Design Guidelines, Techniques and Applications. Borgo, Kehrer, Chung, Maguire, Laramee, Hauser, Ward, and Chen. In Eurographics State of the Art Reports, pp. 39–63, 2013.

35