
https://www.cs.ubc.ca/~tmm/courses/436V-20
Information Visualization Interactive Views
Tamara Munzner Department of Computer Science University of British Columbia
Lect 8/9/10, 30 Jan & 4/6 Feb 2020
Upcoming
- Foundations 3: out Thu Jan 30, due Wed Feb 5 6pm
- Programming 2: out Thu Jan 30, due Wed Feb 12 6pm
- D3 videos/readings week 4
–The General Update Pattern of D3.js [60 min] –Interaction with Unidirectional Data Flow [16 min] –Read: Reusable D3 Components
- Quiz 4, due by Fri Jan 31, 8am
2
Interactive Views
3
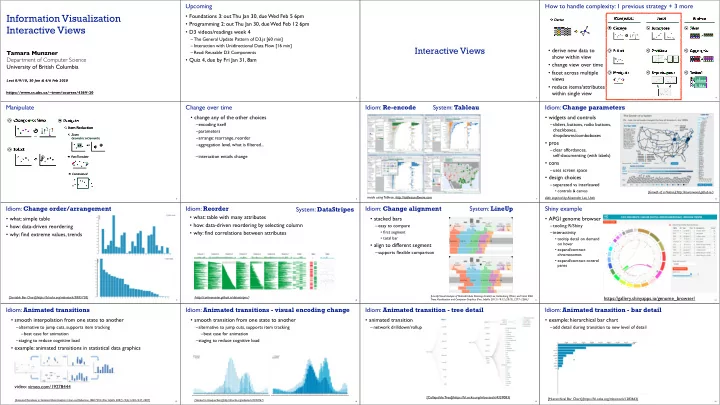
How to handle complexity: 1 previous strategy + 3 more
4
Manipulate Facet Reduce Change Select Navigate Juxtapose Partition Superimpose Filter Aggregate Embed Derive
- derive new data to
show within view
- change view over time
- facet across multiple
views
- reduce items/attributes
within single view
5
Manipulate
Navigate Item Reduction
Zoom Pan/Translate Constrained Geometric or Semantic
Change over Time Select
Change over time
6
- change any of the other choices
–encoding itself –parameters –arrange: rearrange, reorder –aggregation level, what is filtered... –interaction entails change
7
Idiom: Re-encode
made using Tableau, http://tableausoftware.com
System: Tableau Idiom: Change parameters
- widgets and controls
–sliders, buttons, radio buttons, checkboxes, dropdowns/comboboxes
- pros
–clear affordances, self-documenting (with labels)
- cons
–uses screen space
- design choices
–separated vs interleaved
- controls & canvas
8
[Growth of a Nation](http://laurenwood.github.io/) slide inspired by: Alexander Lex, Utah
Idiom: Change order/arrangement
9
- what: simple table
- how: data-driven reordering
- why: find extreme values, trends
[Sortable Bar Chart](https://bl.ocks.org/mbostock/3885705)
Idiom: Reorder
10
- what: table with many attributes
- how: data-driven reordering by selecting column
- why: find correlations between attributes
System: DataStripes
[http://carlmanaster.github.io/datastripes/]
Idiom: Change alignment
11
- stacked bars
–easy to compare
- first segment
- total bar
- align to different segment
–supports flexible comparison
System: LineUp
[LineUp: Visual Analysis of Multi-Attribute Rankings.Gratzl, Lex, Gehlenborg, Pfister, and Streit. IEEE Trans. Visualization and Computer Graphics (Proc. InfoVis 2013) 19:12 (2013), 2277–2286.]
Shiny example
- APGI genome browser
–tooling: R/Shiny –interactivity
- tooltip detail on demand
- n hover
- expand/contract
chromosomes
- expand/contract control
panes
12
https://gallery.shinyapps.io/genome_browser/
Idiom: Animated transitions
- smooth interpolation from one state to another
–alternative to jump cuts, supports item tracking –best case for animation –staging to reduce cognitive load
- example: animated transitions in statistical data graphics
video: vimeo.com/19278444
13
[Animated Transitions in Statistical Data Graphics. Heer and Robertson. IEEE TVCG (Proc InfoVis 2007) 13(6):1240-1247, 2007]
Idiom: Animated transitions - visual encoding change
14
[Stacked to Grouped Bars](http://bl.ocks.org/mbostock/3943967)
- smooth transition from one state to another
–alternative to jump cuts, supports item tracking –best case for animation –staging to reduce cognitive load
Idiom: Animated transition - tree detail
- animated transition
–network drilldown/rollup
15
[Collapsible Tree](https://bl.ocks.org/mbostock/4339083)
Idiom: Animated transition - bar detail
- example: hierarchical bar chart
–add detail during transition to new level of detail
16
[Hierarchical Bar Chart](https://bl.ocks.org/mbostock/1283663)