Week 5: Encode Manipulate Facet Reduce Manipulate Facet Reduce - - PowerPoint PPT Presentation

week 5
SMART_READER_LITE
LIVE PREVIEW

Week 5: Encode Manipulate Facet Reduce Manipulate Facet Reduce - - PowerPoint PPT Presentation

How to handle complexity: 1 previous strategy + 3 more Manipulate How? Encode Manipulate Facet Week 5: Encode Manipulate Facet Reduce Manipulate Facet Reduce Change over Time Navigate Map Derive Arrange Change Juxtapose Filter


slide-1
SLIDE 1

@tamaramunzner www.cs.ubc.ca/~tmm/courses/journ17

Week 5: Interaction

Tamara Munzner Department of Computer Science University of British Columbia

JRNL 520H, Special Topics in Contemporary Journalism: DataVisualization Week 5: 17 Oct 2017 (Guest Lecture)

2

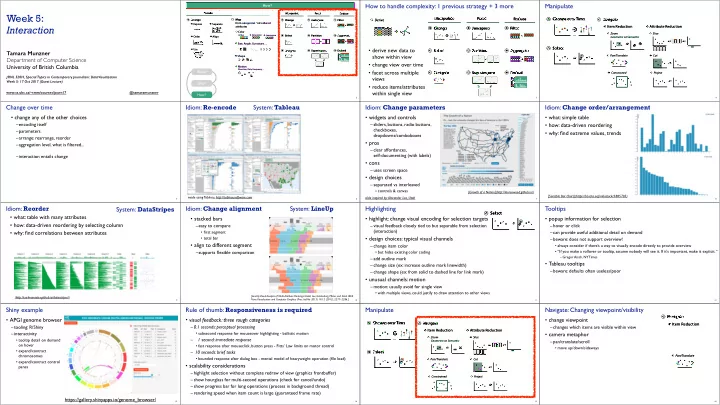
Encode Arrange Express Separate Order Align Use Manipulate Facet Reduce Change Select Navigate Juxtapose Partition Superimpose Filter Aggregate Embed

How? Encode Manipulate Facet

Map Color Motion Size, Angle, Curvature, ...

Hue Saturation Luminance

Shape

Direction, Rate, Frequency, ...

from categorical and ordered attributes

How to handle complexity: 1 previous strategy + 3 more

3

Manipulate Facet Reduce Change Select Navigate Juxtapose Partition Superimpose Filter Aggregate Embed Derive

  • derive new data to

show within view

  • change view over time
  • facet across multiple

views

  • reduce items/attributes

within single view

4

Manipulate

Navigate Item Reduction

Zoom Pan/Translate Constrained Geometric or Semantic

Attribute Reduction

Slice Cut Project

Change over Time Select

Change over time

5

  • change any of the other choices

–encoding itself –parameters –arrange: rearrange, reorder –aggregation level, what is filtered... –interaction entails change

6

Idiom: Re-encode

made using Tableau, http://tableausoftware.com

System: Tableau Idiom: Change parameters

  • widgets and controls

–sliders, buttons, radio buttons,
 checkboxes, 
 dropdowns/comboboxes

  • pros

–clear affordances,
 self-documenting (with labels)

  • cons

–uses screen space

  • design choices

–separated vs interleaved

  • controls & canvas

7

[Growth of a Nation](http://laurenwood.github.io/) slide inspired by: Alexander Lex, Utah

Idiom: Change order/arrangement

8

  • what: simple table
  • how: data-driven reordering
  • why: find extreme values, trends

[Sortable Bar Chart](https://bl.ocks.org/mbostock/3885705)

Idiom: Reorder

9

  • what: table with many attributes
  • how: data-driven reordering by selecting column
  • why: find correlations between attributes

System: DataStripes

[http://carlmanaster.github.io/datastripes/]

Idiom: Change alignment

10

  • stacked bars

–easy to compare

  • first segment
  • total bar
  • align to different segment

–supports flexible comparison

System: LineUp

[LineUp: Visual Analysis of Multi-Attribute Rankings.Gratzl, Lex, Gehlenborg, Pfister, and Streit. IEEE Trans. Visualization and Computer Graphics (Proc. InfoVis 2013) 19:12 (2013), 2277–2286.]

Highlighting

  • highlight: change visual encoding for selection targets

–visual feedback closely tied to but separable from selection (interaction)

  • design choices: typical visual channels

–change item color

  • but hides existing color coding

–add outline mark –change size (ex: increase outline mark linewidth) –change shape (ex: from solid to dashed line for link mark)

  • unusual channels: motion

–motion: usually avoid for single view

  • with multiple views, could justify to draw attention to other views

11

Select

Tooltips

  • popup information for selection

–hover or click –can provide useful additional detail on demand –beware: does not support overview!

  • always consider if there’s a way to visually encode directly to provide overview
  • “If you make a rollover or tooltip, assume nobody will see it. If it's important, make it explicit. “

– Gregor Aisch, NYTimes

  • Tableau tooltips

–beware: defaults often useless/poor

12

Shiny example

  • APGI genome browser

–tooling: R/Shiny –interactivity

  • tooltip detail on demand
  • n hover
  • expand/contract

chromosomes

  • expand/contract control

panes

13

https://gallery.shinyapps.io/genome_browser/

Rule of thumb: Responsiveness is required

  • visual feedback: three rough categories

–0.1 seconds: perceptual processing

  • subsecond response for mouseover highlighting - ballistic motion

– 1 second: immediate response

  • fast response after mouseclick, button press - Fitts’ Law limits on motor control

– 10 seconds: brief tasks

  • bounded response after dialog box - mental model of heavyweight operation (file load)
  • scalability considerations

–highlight selection without complete redraw of view (graphics frontbuffer) –show hourglass for multi-second operations (check for cancel/undo) –show progress bar for long operations (process in background thread) –rendering speed when item count is large (guaranteed frame rate)

14 15

Manipulate

Navigate Item Reduction

Zoom Pan/Translate Constrained Geometric or Semantic

Attribute Reduction

Slice Cut Project

Change over Time Select

Navigate: Changing viewpoint/visibility

  • change viewpoint

–changes which items are visible within view

  • camera metaphor

–pan/translate/scroll

  • move up/down/sideways

16

Navigate Item Reduction

Zoom Pan/Translate Geometric or Semantic

slide-2
SLIDE 2

Idiom: Scrollytelling

  • how: navigate page by scrolling (panning down)
  • pros:

–familiar & intuitive, from standard web browsing –linear (only up & down) vs possible overload of click-based interface choices

  • cons:

–full-screen mode may lack affordances –scrolljacking, no direct access –unexpected behaviour –continuous control for discrete steps

17

https://eagereyes.org/blog/2016/the-scrollytelling-scourge [How to Scroll, Bostock](https://bost.ocks.org/mike/scroll/) slide inspired by: Alexander Lex, Utah

Scrollytelling examples

18

slide inspired by: Alexander Lex, Utah https://www.bloomberg.com/graphics/ 2015-whats-warming-the-world/ https://www.nytimes.com/interactive/2015/09/30/business/ how-the-us-and-opec-drive-oil-prices.html?_r=1

Navigate: Changing viewpoint/visibility

  • change viewpoint

–changes which items are visible within view

  • camera metaphor

–pan/translate/scroll

  • move up/down/sideways

–rotate/spin

  • typically in 3D

–zoom in/out

  • enlarge/shrink world == move camera closer/further
  • geometric zoom: standard, like moving physical object

19

Navigate Item Reduction

Zoom Pan/Translate Geometric or Semantic

Navigate: Unconstrained vs constrained

  • unconstrained navigation

–easy to implement for designer –hard to control for user

  • easy to overshoot/undershoot
  • constrained navigation

–typically uses animated transitions –trajectory automatically computed based on selection

  • just click; selection ends up framed nicely in final viewport

20

Navigate Item Reduction

Zoom Pan/Translate Constrained Geometric or Semantic

Idiom: Animated transition + constrained navigation

  • example: geographic map

–simple zoom, only viewport changes, shapes preserved

21

[Zoom to Bounding Box](https://bl.ocks.org/mbostock/4699541)

Idiom: Animated transition + constrained navigation

  • example: icicle plot

–transition into containing mark causes aspect ratio (shape) change

22

[Zoomable Icicle](https://bl.ocks.org/mbostock/1005873)

Idiom: Animated transitions

  • smooth interpolation from one state to another

–alternative to jump cuts, supports item tracking –best case for animation –staging to reduce cognitive load

  • example: animated transitions in statistical data graphics


video: vimeo.com/19278444

23

[Animated Transitions in Statistical Data Graphics. Heer and Robertson. IEEE TVCG (Proc InfoVis 2007) 13(6):1240-1247, 2007]

Idiom: Animated transitions - visual encoding change

24

[Stacked to Grouped Bars](http://bl.ocks.org/mbostock/3943967)

  • smooth transition from one state to another

–alternative to jump cuts, supports item tracking –best case for animation –staging to reduce cognitive load

Idiom: Animated transition - tree detail

  • animated transition

–network drilldown/rollup

25

[Collapsible Tree](https://bl.ocks.org/mbostock/4339083)

Idiom: Animated transition - bar detail

  • example: hierarchical bar chart

–add detail during transition to new level of detail

26

[Hierarchical Bar Chart](https://bl.ocks.org/mbostock/1283663)

Navigate: Reducing attributes

  • continuation of camera metaphor

–slice

  • show only items matching specific value


for given attribute: slicing plane

  • axis aligned, or arbitrary alignment

–cut

  • show only items on far slide of plane 


from camera

–project

  • change mathematics of image creation

– orthographic (eliminate 3rd dimension) – perspective (foreshortening captures limited 3D information)

27

[Interactive Visualization of Multimodal Volume Data for Neurosurgical Tumor Treatment. Rieder, Ritter, Raspe, and Peitgen. Computer Graphics Forum (Proc. EuroVis 2008) 27:3 (2008), 1055–1062.]

Attribute Reduction

Slice Cut Project

Navigate: Cartographic projections

  • project from 2D sphere surface to 2D plane

–can only fully preserve 2 out of 3

  • angles: conformal
  • area: equal area
  • contiguity: no interruptions

28

[Every Map Projection](https://bl.ocks.org/mbostock/ 29cddc0006f8b98eff12e60dd08f59a7) https://www.jasondavies.com/maps/tissot/ https://www.win.tue.nl/~vanwijk/ myriahedral/

Interaction technology

  • what do you design for?

–mouse & keyboard on desktop?

  • large screens, hover, multiple clicks

–touch interaction on mobile?

  • small screens, no hover, just tap

–gestures from video / sensors?

  • ergonomic reality vs movie bombast

–eye tracking?

29

www.youtube.com/watch?v=QXLfT9sFcbc I Hate Tom Cruise - Alex Kauffmann (5 min)

slide inspired by: Alexander Lex, Utah

vimeo.com/182590214 Data visualization and the news - Gregor Aisch (37 min)

Interaction benefits

30

  • interaction pros

–major advantage of computer-based vs paper-based visualization –flexible, powerful, intuitive

  • exploratory data analysis: change as you go during analysis process
  • fluid task switching: different visual encodings support different tasks

–animated transitions provide excellent support

  • empirical evidence that animated transitions help people stay oriented

Interaction limitations

31

  • interaction has a time cost

–sometimes minor, sometimes significant –degenerates to human-powered search in worst case

  • remembering previous state imposes cognitive load

–rule of thumb: eyes over memory

  • hard to compare visible item to memory of what you saw
  • ex: maintaining context/orientation when navigating
  • ex: tracking complex changes during animation
  • controls may take screen real estate

–or invisible functionality may be difficult to discover (lack of affordances)

  • users may not interact as planned by designer

–NYTimes logs show ~90% don’t interact beyond scrollytelling - Aisch, 2016

Facet

32

Juxtapose Partition Superimpose

slide-3
SLIDE 3

Juxtapose and coordinate views

33

Share Encoding: Same/Difgerent Share Data: All/Subset/None Share Navigation

Linked Highlighting

Idiom: Linked highlighting

34

System: EDV

  • see how regions contiguous in one

view are distributed within another –powerful and pervasive interaction idiom

  • encoding: different

–multiform

  • data: all shared
  • aka: brushing and linking

[Visual Exploration of Large Structured Datasets.

  • Wills. Proc. New

Techniques and Trends in Statistics (NTTS), pp. 237–246. IOS Press, 1995.]

Linked views

  • unidirectional vs bidirectional linking

35

http://www.ralphstraumann.ch/projects/swiss-population-cartogram/ http://peterbeshai.com/linked-highlighting-react-d3-reflux/

Linked views: Multidirectional linking

36

http://buckets.peterbeshai.com/

https://medium.com/@pbesh/linked-highlighting-with-react-d3-js-and-reflux-16e9c0b2210b

System: Buckets Video: Visual Analysis of Historical Hotel Visitation Patterns

37

http://www.cs.ou.edu/~weaver/improvise/examples/hotels/ https://www.youtube.com/watch?v=Tzsv6wkZoiQ

Idiom: Overview-detail views

38

  • encoding: same
  • data: subset shared
  • navigation: shared

–bidirectional linking

  • differences

–viewpoint –(size)

  • special case:


birds-eye map

System: Google Maps

[A Review of Overview+Detail, Zooming, and Focus+Context Interfaces. Cockburn, Karlson, and Bederson. ACM Computing Surveys 41:1 (2008), 1–31.]

Idiom: Overview-detail navigation

  • encoding: same
  • data: subset shared
  • navigation: shared

–unidirectional linking –select in small overview –change extent in large detail view

39

https://www.highcharts.com/ demo/dynamic-master-detail

https://bl.ocks.org/mbostock/34f08d5e11952a80609169b7917d4172

Overview-detail

  • multiscale: three viewing levels

–linked views –dynamic filtering –tooling: processing 
 (modern version: p5js.org)

40

System: MizBee

https://www.youtube.com/watch?v=86p7brwuz2g

Idiom: Small multiples

  • encoding: same
  • data: none shared

–different attributes for node colors –(same network layout)

  • navigation: shared

41

System: Cerebral

[Cerebral: Visualizing Multiple Experimental Conditions on a Graph with Biological Context. Barsky, Munzner, Gardy, and Kincaid. IEEE Trans. Visualization and Computer Graphics (Proc. InfoVis 2008) 14:6 (2008), 1253–1260.]

Coordinate views: Design choice interaction

42

All Subset Same Multiform Multiform, Overview/ Detail None Redundant No Linkage Small Multiples Overview/ Detail

  • why juxtapose views?

–benefits: eyes vs memory

  • lower cognitive load to move eyes between 2 views than remembering previous state with

single changing view

–costs: display area, 2 views side by side each have only half the area of one view

43

Why not animation?

  • disparate frames and

regions: comparison difficult

–vs contiguous frames –vs small region –vs coherent motion of group

  • safe special case

–animated transitions

Partition into views

44

  • how to divide data between views

–split into regions by attributes –encodes association between items using spatial proximity –order of splits has major implications for what patterns are visible

Partition into Side-by-Side Views

Partitioning: List alignment

  • single bar chart with grouped bars

–split by state into regions

  • complex glyph within each region showing all

ages

–compare: easy within state, hard across ages

  • small-multiple bar charts

–split by age into regions

  • one chart per region

–compare: easy within age, harder across states

45

11.0 10.0 9.0 8.0 7.0 6.0 5.0 4.0 3.0 2.0 1.0 0.0 CA TK NY FL IL PA 65 Years and Over 45 to 64 Years 25 to 44 Years 18 to 24 Years 14 to 17 Years 5 to 13 Years Under 5 Years CA TK NY FL IL PA

5 11 5 11 5 11 5 11 5 11 5 11 5 11

Partitioning: Recursive subdivision

  • split by neighborhood
  • then by type
  • then time

–years as rows –months as columns

  • color by price
  • neighborhood patterns

–where it’s expensive –where you pay much more for detached type

46

[Configuring Hierarchical Layouts to Address Research Questions. Slingsby, Dykes, and

  • Wood. IEEE

Transactions on Visualization and Computer Graphics (Proc. InfoVis 2009) 15:6 (2009), 977–984.]

System: HIVE Partitioning: Recursive subdivision

  • switch order of splits

–type then neighborhood

  • switch color

–by price variation

  • type patterns

–within specific type, which neighborhoods inconsistent

47

[Configuring Hierarchical Layouts to Address Research Questions. Slingsby, Dykes, and

  • Wood. IEEE

Transactions on Visualization and Computer Graphics (Proc. InfoVis 2009) 15:6 (2009), 977–984.]

System: HIVE Partitioning: Recursive subdivision

  • different encoding for

second-level regions

–choropleth maps

48

[Configuring Hierarchical Layouts to Address Research Questions. Slingsby, Dykes, and

  • Wood. IEEE

Transactions on Visualization and Computer Graphics (Proc. InfoVis 2009) 15:6 (2009), 977–984.]

System: HIVE

slide-4
SLIDE 4

Superimpose layers

49

  • layer: set of objects spread out over region

–each set is visually distinguishable group –extent: whole view

  • design choices

–how many layers, how to distinguish?

  • encode with different, nonoverlapping channels
  • two layers achieveable, three with careful design

–small static set, or dynamic from many possible? Superimpose Layers

Static visual layering

  • foreground layer: roads

–hue, size distinguishing main from minor –high luminance contrast from background

  • background layer: regions

–desaturated colors for water, parks, land areas

  • user can selectively focus attention
  • “get it right in black and white”

–check luminance contrast with greyscale view

50

[Get it right in black and white. Stone. 2010. 
 http://www.stonesc.com/wordpress/2010/03/get-it-right-in-black-and-white]

Superimposing limits

  • few layers, but many lines

–up to a few dozen –but not hundreds

  • superimpose vs juxtapose: empirical study

–superimposed for local, multiple for global –tasks

  • local: maximum, global: slope, discrimination

–same screen space for all multiples vs single superimposed

51

[Graphical Perception of Multiple Time Series. Javed, McDonnel, and Elmqvist. IEEE Transactions

  • n

Visualization and Computer Graphics (Proc. IEEE InfoVis 2010) 16:6 (2010), 927–934.]

CPU utilization over time 100 80 60 40 20 05:00 05:30 06:00 06:30 07:00 07:30 08:00 05:00 05:30 06:00 06:30 07:00 07:30 08:00 100 80 60 40 20 05:00 05:30 06:00 06:30 07:00 07:30 08:00 100 80 60 40 20

Idiom: Trellis plots

  • superimpose within same frame

–color code by year

  • partitioning

–split by site, rows are wheat varieties

  • main-effects ordering

–derive value of median for group, use to order –order rows within view by variety median –order views themselves by site median

52

Dynamic visual layering

  • interactive based on selection
  • one-hop neighbour highlighting demos: click vs hover (lightweight)

53

http://mariandoerk.de/edgemaps/demo/ http://mbostock.github.io/d3/talk/20111116/airports.html

Reduce items and attributes

54

  • reduce/increase: inverses
  • filter

–pro: straightforward and intuitive

  • to understand and compute

–con: out of sight, out of mind

  • aggregation

–pro: inform about whole set –con: difficult to avoid losing signal

  • not mutually exclusive

–combine filter, aggregate –combine reduce, change, facet

Reduce

Filter Aggregate Embed

Reducing Items and Attributes Filter Items Attributes Aggregate Items Attributes

Idiom: dynamic filtering

  • item filtering
  • browse through tightly coupled interaction

–alternative to queries that might return far too many or too few

55

System: FilmFinder

[Visual information seeking: Tight coupling of dynamic query filters with starfield displays. Ahlberg and Shneiderman.

  • Proc. ACM Conf. on Human Factors in Computing Systems (CHI), pp. 313–317, 1994.]

Idiom: cross filtering

  • item filtering
  • coordinated views/controls combined
  • all scented histogram bisliders update when any ranges change

56

System: Crossfilter

[http://square.github.io/crossfilter/]

Idiom: cross filtering

57

[https://www.nytimes.com/interactive/2014/upshot/buy-rent-calculator.html?_r=0]

Idiom: histogram

  • static item aggregation
  • task: find distribution
  • data: table
  • derived data

–new table: keys are bins, values are counts

  • bin size crucial

–pattern can change dramatically depending on discretization –opportunity for interaction: control bin size on the fly

58

20 15 10 5 Weight Class (lbs)

Idiom: scented widgets

  • augmented widgets show information scent

–cues to show whether value in drilling down further vs looking elsewhere

  • concise use of space: histogram on slider

59

[Scented Widgets: Improving Navigation Cues with Embedded Visualizations. Willett, Heer, and Agrawala. IEEE TVCG (Proc. InfoVis 2007) 13:6 (2007), 1129–1136.] [Multivariate Network Exploration and Presentation: From Detail to Overview via Selections and Aggregations. van den Elzen, van Wijk, IEEE TVCG 20(12): 2014 (Proc. InfoVis 2014).]

Scented histogram bisliders: detailed

60

[ICLIC: Interactive categorization of large image collections. van der Corput and van

  • Wijk. Proc. PacificVis 2016. ]

Idiom: Continuous scatterplot

  • static item aggregation
  • data: table
  • derived data: table

– key attribs x,y for pixels – quant attrib: overplot density

  • dense space-filling 2D

matrix

  • color: sequential

categorical hue +

  • rdered luminance

colormap

61

[Continuous Scatterplots. Bachthaler and

  • Weiskopf. 


IEEE TVCG (Proc. Vis 08) 14:6 (2008), 1428–1435. 2008. ]

Spatial aggregation

  • MAUP: Modifiable Areal Unit Problem

–gerrymandering (manipulating voting district boundaries) is only one example! –zone effects –scale effects

62

[http://www.e-education.psu/edu/geog486/l4_p7.html, Fig 4.cg.6]

https://blog.cartographica.com/blog/2011/5/19/ the-modifiable-areal-unit-problem-in-gis.html

Idiom: boxplot

  • static item aggregation
  • task: find distribution
  • data: table
  • derived data

–5 quant attribs

  • median: central line
  • lower and upper quartile: boxes
  • lower upper fences: whiskers

– values beyond which items are outliers

–outliers beyond fence cutoffs explicitly shown

63

! ! ! ! ! ! ! ! !

n s k mm !2 2 4

[40 years of boxplots. Wickham and Stryjewski. 2012. had.co.nz]

Aggregation and Tableau

  • Tableau aggregates by default: challenge is often dis-aggregation!

64

http://onlinehelp.tableau.com/current/pro/desktop/en-us/calculations_aggregation_ex1aggregate.html http://onlinehelp.tableau.com/current/pro/desktop/en-us/buildexamples_scatter.html

slide-5
SLIDE 5

Best practices: From single views to dashboards

  • make visualizations as self-documenting as possible

–meaningful & useful title, labels, legends

  • axes and panes/subwindows should have labels

– and axes should have good mix/max boundary tick marks

  • everything that’s plotted should have a legend

– and own header/labels if not redundant with main title

  • use reasonable numerical format

– avoid scientific notation in most cases

65

[https://xkcd.com/833/]

Best practices with Tableau: Makeover Mondays

  • learn about best practices, get inspired with what’s possible
  • great practice for you, or browse what others have done

66

http://www.makeovermonday.co.uk/blog/