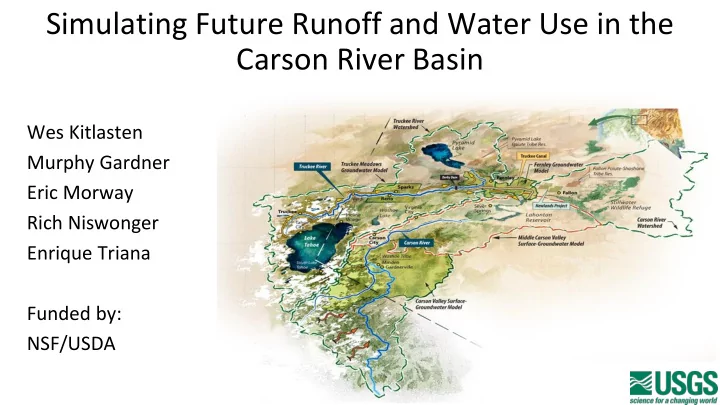
SLIDE 1 Simulating Future Runoff and Water Use in the Carson River Basin
Wes Kitlasten Murphy Gardner Eric Morway Rich Niswonger Enrique Triana Funded by: NSF/USDA
SLIDE 2 Overview
- What does the historical data suggest?
- What adjustments do our models need to
account for changing runoff patterns?
- How does the system respond?
- Who is affected?
SLIDE 3 Establish what existing trends are telling us
# Days > 90˚ F Minden
SLIDE 4 Establish what existing trends are telling us
# Days > 90˚ F
SLIDE 5 Examine long-term trends of different flow regimes
Minimum 1-Day Flow
Median 1-Day Flow Maximum 1-Day Flow
SLIDE 6 3-prong modeling approach
Modeling Introduction
SLIDE 7 Julian day of 50% of total annual runoff for different levels of warming
2011 2039 2084 2011 2039 2084
SLIDE 8
Impacts of Warming on Inflows to Carson Valley
SLIDE 9 3-prong modeling approach
Modeling Operations
- 2. Focus on river operations
SLIDE 10
SLIDE 11 MODSIM
http://modsim.engr.colostate.edu/
Carson River Operations Model
SLIDE 12 Total Delivery – All Decades Simulations for 1980-2015 All Results are differenced from Historical +0C
Water Right Decree Date by Decade
SLIDE 13 % Change in Delivery – All Decades
Water Right Decree Date by Decade
SLIDE 14
Total Delivery – first/last decade of decreed WRs
SLIDE 15 Cumulative Flows at Ft. Churchill
Irrigation season
Average increase of 22,000 acre- ft per year of water flowing to Lahontan
SLIDE 16
Increases in Supplementary Pumping
SLIDE 17 Irrigation season
Differences in GW drawdown (+4.3C)
SLIDE 18
Thank you
SLIDE 19
SLIDE 20 Review Historical Data
Is historical water use sustainable? Can we already see the impacts of climate change?
SLIDE 21
Measured flows on East Fork Carson at Gardnerville
SLIDE 22
Relationship between inflows and outflows through Carson Valley has Changed (Aug-Sep)
SLIDE 23 Photo credit: Republic Manufacturing
Components of water supply and consumption
Snowpack, rain, river, and groundwater storage forecast
Runoff to rivers Water allocations for agricultural, municipal, and industrial uses; conjunctive use
SLIDE 24
- Important operational differences
- Surface-water storage vs groundwater
storage
- Rules vs priorities
- Recognize inter-basin dependencies
(Truckee Canal)
Truckee-Carson System
SLIDE 25 Introduction
- Operations modeling benefits from hydrology model
- more realistic representation of SW-GW exchanges,
- account for impacts of GW pumping on surface-water operations
- conjunctive use (track GW supplies)
- dynamic inflows (watershed, tributary inflows)
- Hydrology modeling benefits from operations model
- Reservoir operations
- Distributed diversions, water governance
(priorities, rules, banking)
- Water use
- Water markets
- 3rd-party impacts
SLIDE 26 Integrated Hydrology-Operations Model that Considers Nonlinear Feedbacks
Nonlinear feedbacks illustrated by changes in diversions between iterations
Flow, storage, seepage
Nonlinear iteration
Releases, diversions
Hydrology Operations
SLIDE 27 Change in fraction of snow versus rain for different levels of warming GCM projected increase in temperature for next century for Carson River headwaters
2011 2039 2084 2011 2039 2084
SLIDE 28 Trend in maximum 1- day flow
Source: Robert Hirsch, USGS
Trend in minimum 1-day flow Trend in median flow
SLIDE 29 Source: Robert Hirsch, USGS
Carson Valley West Fork Inflows
- Ranked each water year's daily flows, starting in 1939
- Trend calculated as percent change per year for each exceedance probability
SLIDE 30 Source: Robert Hirsch, USGS
Carson Valley East Fork Inflows
SLIDE 31 Source: Robert Hirsch, USGS
Carson Valley Outflows
- Low flows (< 0.05) are decreasing at an average annual rate of 1-1.3%"
SLIDE 32
Upper Catchment & Carson Valley Hydrology Models
SLIDE 33 Average Snow Covered Area for Period 1980-2015
Historical Historical +4.3C
SLIDE 34 Review Results from SAG4
- 1. +4.3 degree historical simulation
- 1. Results presented as decreases in water delivery by
administration segments
- 1. Increases in pumping; overdrafted aquifers; not
sustainable
- 1. Runoff occurs during winter before irrigation season;
increase in flow to Lahontan
SLIDE 35 Schematic of Pine Nuts – East Valley
From: Maurer, 1986
SLIDE 36 How much will fit?
- Rough estimate:
- 5600 acres
- 20% specific yield (porosity)
- Increase water levels 20’ on average
- Answer: about 22,400 acre-feet
- Complex geology presents site-specific issues
- Requires site-specific evaluation
- Simulations are an improvement of “rough estimate” and help focus
“site-specific” evaluations
- Includes estimate of uncertainty in parameters (hydrologic properties)
SLIDE 37 Potential Impacts
- Elevated groundwater levels
■
Flooding
■
Water logging
■
Keep wells saturated
■
Increase soil moisture
- Potential impacts to municipal wells
■
Arsenic (??)
■
Replenish aquifer with fresh water
- Previously unirrigated lands
■
Legal and logistical issues with winter irrigation on “new” land
■
Undocumented hydrologic response
■
Increased knowledge of the system
SLIDE 38 Sept 1999
- Old surface storage
- Seeps near airport
SLIDE 39 Oct 2006
- Phase out old storage
- New lined storage
- Increased GW use
- Seeps fading
SLIDE 42 Schematic of Pine Nuts – East Valley
From: Maurer, 1986 Focus recharge along faults into permeable layers Ponded water on impermeable substrate
SLIDE 43 Successful MAR in the Pine Nuts
- Find suitable locations
- Coarse grained deposits
- Recharge along faults
- Current modeling effort
- Uncertainty analysis to bound potential amounts
- Data worth analysis to guide potential exploration
- Identify location where GW levels rise to surface
- Explore timing for maximum benefit, minimum adverse impact
SLIDE 44
Broad Reductions in Surface Water Delivery
SLIDE 45 Greater Losses in Carson River Low Flows (Aug-Sep) in Carson Valley
Possible causes: 1) Earlier snow melt and associated earlier onset of aquifer drainage 2) Reductions in bank storage due to flashier hydrograph 3) Increases in groundwater pumping in CV 4) Increases in crop consumptive use and decreases in groundwater recharge (laser leveling, sprinklers, etc.)
SLIDE 46 Simulation of Climate Change Impacts
- Results were reported by administrative segments in previous SAG
- Junior rights on East Fork considered regardless of priority on Main Carson
- Junior rights on West Fork considered regardless of priority on Main Carson
- Results now reported by water right priority year (Alpine Decree)
- Future: Google Earth interface where resulting deliveries for each
water right can be explored by the user?
SLIDE 47 Managed Aquifer Recharge in Carson Valley
Where would the water come from?
- Earlier snowmelt increases pass-through water (22k acre-ft by 2084)
- Simulations indicate decreases in ET in East and West Fork
Watersheds (5-7% or 16,000 to 23,000 acre-feet per year)
- Capture winter floodwaters that would otherwise exit Lahontan
SLIDE 48 Scheduling MAR (Years)
Water Year 1982 1983 1985 1995 1996 1997 1998 2005 2006 2011
Potential years for MAR Average Lahontan storage of 200,000 acre- ft used as a MAR threshold
SLIDE 49 Proposed MAR Scheduling (Seasonal)
Scheduling MAR during Feb-March with Dec-Jan hindsight Proposed diverted MAR flows are 15-20% of flows during MAR winters
SLIDE 50
Changes in GW Head Minden- Gardnerville
SLIDE 51
Significant Increases in Pumping Starting Late ‘80s
SLIDE 52
% Change in Delivery – first/last decade of decreed WRs
SLIDE 53 Cascading Impacts of Agricultural Pumping
Reductions in GW pumping due to excessive drawdown and dewatering of well screens
SLIDE 54 Managed Aquifer Recharge in Carson Valley
Where would the water be applied?
- Deep groundwater
- Areas with existing irrigation infrastructure
- Areas below a certain elevation for gravity driven delivery
- Would require investment in infrastructure (i.e. pipeline, etc)
SLIDE 55 Identifying Suitable MAR Sites
- Shallow groundwater throughout the Carson Valley
- Deeper groundwater in the east and south
- Existing infrastructure vs. new infrastructure
SLIDE 56
- Potential MAR sites considered
- Groundwater deeper than 20’
- Below 4930’ (inflow of East Fk)
- Some overlap of existing water
rights and potential MAR sites
- New MAR land would require new
infrastructure (i.e. pipeline)
- Proposed MAR over 5600 acres for
simulations
- Johnson Lane
- Between Alllerman and Airport