Water Quality in the Yellowstone River Basin Yellowstone River - - PowerPoint PPT Presentation

water quality in the yellowstone river basin
SMART_READER_LITE
LIVE PREVIEW

Water Quality in the Yellowstone River Basin Yellowstone River - - PowerPoint PPT Presentation

Water Quality in the Yellowstone River Basin Yellowstone River Basin Advisory Council November 15 th , 2013 Jill Frankforter Water-Quality Unit Chief U.S. Geological Survey Wyoming-Montana Water Science Center Yellowstone River nr.


slide-1
SLIDE 1

U.S. Department of the Interior U.S. Geological Survey

Water Quality in the Yellowstone River Basin

Jill Frankforter Water-Quality Unit Chief U.S. Geological Survey Wyoming-Montana Water Science Center

U.S. Department of the Interior U.S. Geological Survey

Yellowstone River Basin Advisory Council November 15th, 2013

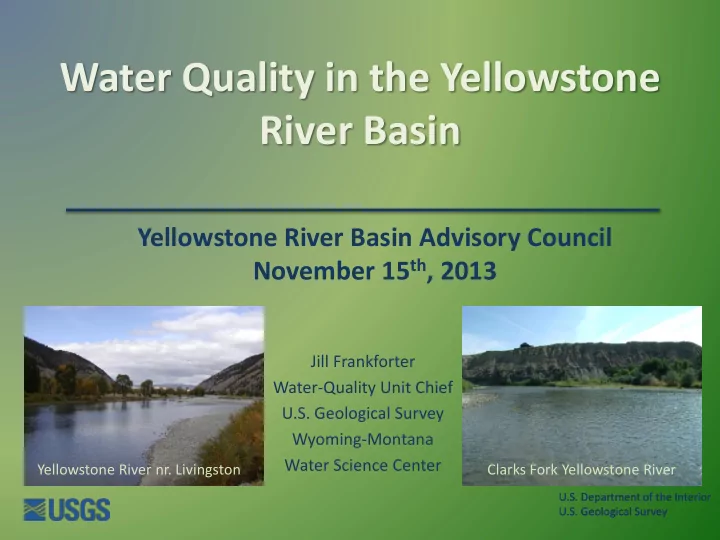
Yellowstone River nr. Livingston Clarks Fork Yellowstone River

slide-2
SLIDE 2

U.S. Department of the Interior U.S. Geological Survey U.S. Department of the Interior U.S. Geological Survey

Presentation objectives

  • Summary of water-quality

results from the National Water-Quality Assessment (NAWQA) Program

  • SPARROW modeling activities

relevant to the Yellowstone River Basin

  • Describe tools to apply the

SPARROW results in the Yellowstone River Basin

slide-3
SLIDE 3

U.S. Department of the Interior U.S. Geological Survey U.S. Department of the Interior U.S. Geological Survey

NAWQA program goals

  • Describe current water-quality conditions

for a large part of the Nation’s freshwater streams and aquifers

  • Describe how water quality is changing over

time

  • Improve our understanding of the primary

natural and human factors affecting water quality

slide-4
SLIDE 4

U.S. Department of the Interior U.S. Geological Survey U.S. Department of the Interior U.S. Geological Survey

NAWQA monitoring in the Yellowstone River Basin

Initial sampling conducted from FY1998-FY2001

  • Stream

chemistry

  • Groundwater

chemistry

  • Stream ecology
slide-5
SLIDE 5

U.S. Department of the Interior U.S. Geological Survey U.S. Department of the Interior U.S. Geological Survey

NAWQA monitoring : Stream chemistry

  • Ten basic fixed sites

– Monthly sampling – High flow sampling

  • Intensive sampling sites

– Biweekly to monthly sampling – Additional high flow samples

  • Bacteria synoptic
slide-6
SLIDE 6

U.S. Department of the Interior U.S. Geological Survey U.S. Department of the Interior U.S. Geological Survey

NAWQA: Stream chemistry results

  • total dissolved solids
  • Mountain

streams dominated by calcium and bicarbonate

  • Plains streams

dominated by sodium and sulfate

slide-7
SLIDE 7

U.S. Department of the Interior U.S. Geological Survey U.S. Department of the Interior U.S. Geological Survey

NAWQA: Stream chemistry results

  • nitrogen
  • Vary seasonally and

related to land use

  • Total nitrogen

concentrations highest in the Little Powder and Powder

  • Nitrate concentrations

highest in Clarks Fork Yellowstone and Bighorn Rivers

slide-8
SLIDE 8

U.S. Department of the Interior U.S. Geological Survey U.S. Department of the Interior U.S. Geological Survey

NAWQA: Stream chemistry results

  • phosphorus and suspended sediment
  • Naturally occurring

in soils

  • Associated with

suspended sediment concentrations

  • Highest in

rangeland areas with erodible soils and less vegetation

slide-9
SLIDE 9

U.S. Department of the Interior U.S. Geological Survey U.S. Department of the Interior U.S. Geological Survey

NAWQA: Stream chemistry results

  • trace elements
  • High arsenic concentrations

in upper reaches from naturally occurring sources

  • Lower arsenic

concentrations downstream due to dilution

  • Other trace elements with

elevated concentrations include selenium, mercury

slide-10
SLIDE 10

U.S. Department of the Interior U.S. Geological Survey U.S. Department of the Interior U.S. Geological Survey

NAWQA: Stream chemistry results

  • bacteria synoptic
  • Exceedance of the USEPA recommended limits for:

– Fecal coliform primary contact recreation (>400 col/100mL in 37 samples) – E. coli recommended limit for moderate use, full-body contact (>298 col/100 mL in 38 samples) – E. coli recommended limit for infrequent use, full-body contact recreation (>576 col/100 mL in 25 samples)

  • Potential sources in agricultural and urban area are sewage

treatment plants; agricultural, domestic, and wildlife waste; and septic systems

slide-11
SLIDE 11

U.S. Department of the Interior U.S. Geological Survey U.S. Department of the Interior U.S. Geological Survey

NAWQA monitoring in the Yellowstone River Basin: groundwater chemistry

  • Aquifer surveys

– Quaternary unconsolidated aquifers – Lower Tertiary aquifers

  • Land use

monitoring survey

slide-12
SLIDE 12

U.S. Department of the Interior U.S. Geological Survey U.S. Department of the Interior U.S. Geological Survey

  • Concentrations higher

than most shallow wells in the nation

  • Samples with high TDS

dominated by sodium and bicarbonate

  • Frequently exceeded

USEPA secondary drinking-water standard

  • f 500 mg/L

NAWQA: Groundwater chemistry results

  • total dissolved solids
slide-13
SLIDE 13

U.S. Department of the Interior U.S. Geological Survey U.S. Department of the Interior U.S. Geological Survey

NAWQA: Groundwater chemistry results

  • nitrogen
  • Concentrations of nitrate in 8 percent of samples collected from

Quaternary aquifers and 3 percent from the lower Tertiary aquifers exceeded the USEPA drinking-water standard of 10 mg/L

  • Concentration related to surrounding land uses:
  • In Quaternary aquifers increased with the percentage of

cropland and other agricultural land; decreased as the percentage of rangeland and riparian land increased

  • In the lower Tertiary aquifer samples, nitrate concentrations

increased with the percentage of cropland overlying the aquifer.

slide-14
SLIDE 14

U.S. Department of the Interior U.S. Geological Survey U.S. Department of the Interior U.S. Geological Survey

NAWQA: Groundwater chemistry results

  • radon
  • Naturally-occurring concentrations higher than in

most shallow wells in the nation

  • 52 of 54 samples exceeded the USEPA proposed

drinking-water standard of 300pCI/L

slide-15
SLIDE 15

U.S. Department of the Interior U.S. Geological Survey U.S. Department of the Interior U.S. Geological Survey

NAWQA: Groundwater chemistry results

  • trace elements
  • Trace element concentrations found in samples

from Quaternary wells didn’t exceed federal standards and guidelines

  • In samples from the Lower Tertiary wells,

drinking-water standards for antimony, boron, cadmium, and selenium were exceeded once, and twice for molybdenum.

slide-16
SLIDE 16

U.S. Department of the Interior U.S. Geological Survey U.S. Department of the Interior U.S. Geological Survey

NAWQA: Stream and groundwater chemistry

  • pesticides
  • Frequently

detected but at low concentrations

  • Atrazine was the

most frequently detected

  • Breakdown

products present in surface- and groundwater

slide-17
SLIDE 17

U.S. Department of the Interior U.S. Geological Survey U.S. Department of the Interior U.S. Geological Survey

NAWQA monitoring in the Yellowstone River Basin: ecology sites

  • Basic fixed or

intensive sampling sites

  • Bed sediment and

fish tissue sites

  • Algal-nutrient study
slide-18
SLIDE 18

U.S. Department of the Interior U.S. Geological Survey U.S. Department of the Interior U.S. Geological Survey

NAWQA: Tissue and bed sediment sample results

  • pesticides and organic compounds
  • DDT, dieldrin, and

chlordane present in several fish samples

  • Just one bed

sediment sample contained DDT

  • PCBs in 3 of 33 fish

samples

slide-19
SLIDE 19

U.S. Department of the Interior U.S. Geological Survey U.S. Department of the Interior U.S. Geological Survey

NAWQA: Ecology

  • periphyton chlorophyll and invertebrates
  • Chlorophyll concentrations in

Yellowstone at Billings and Bighorn River in range of severely impaired

  • Pollution tolerant taxa (midges

and worms) dominant in middle section of Yellowstone at sites downstream of major tributaries

  • Mayfly, stonefly, and caddisfly

species dominate in upper and lower segments of the Yellowstone and most tributaries

slide-20
SLIDE 20

U.S. Department of the Interior U.S. Geological Survey U.S. Department of the Interior U.S. Geological Survey

NAWQA monitoring in the Yellowstone River Basin, FY2002-FY2012

  • Surface Water
  • Yellowstone River at Forsyth, MT (dropped in FY2010)
  • Yellowstone River near Sidney, MT
  • Bighorn River at Kane, WY (dropped in FY2010)
  • Little Powder above Dry Creek nr Weston, WY
  • Groundwater
  • Alluvial aquifers study 2011-2012
  • Ecology
  • Little Powder River above Dry Creek near Weston, WY
slide-21
SLIDE 21

U.S. Department of the Interior U.S. Geological Survey U.S. Department of the Interior U.S. Geological Survey

Current NAWQA monitoring in the Yellowstone River Basin (FY2013)

  • Surface water
  • Yellowstone nr Sidney, MT
  • Little Powder above Dry Creek nr Weston, WY
  • Groundwater
  • None
  • Ecology
  • Little Powder above Dry Creek nr Weston, WY
slide-22
SLIDE 22

U.S. Department of the Interior U.S. Geological Survey

SPARROW modeling

(SPAtially Referenced Regressions On Watershed attributes)

  • Determine P and N loading to various receiving waters over

large spatial scales

  • Determine where are the main contributing basins (rank

contributing basins based on loads and yields)

  • Determine what are the main causes of the high loads

(describe the relative importance of nutrient sources)

  • Provide information to various states and regional
  • rganizations to support regional interpretation and guide

local, more in-depth studies

slide-23
SLIDE 23

U.S. Department of the Interior U.S. Geological Survey U.S. Department of the Interior U.S. Geological Survey

SPARROW model elements

Hydrologic network Predicted loads & concentrations Monitoring data Geographical data (Examples)

slide-24
SLIDE 24

U.S. Department of the Interior U.S. Geological Survey U.S. Department of the Interior U.S. Geological Survey

History/Status of SPARROW modeling

  • National model (1992)
  • Suspended sediment
  • Total nitrogen
  • Total phosphorus
  • Total organic carbon
  • Regional models:

– Missouri River Basin and Pacific Northwest (2002)

  • Total nitrogen
  • Total phosphorus

– Mississippi River Basin Model (release pending) – NHDPlus Nutrient Models (under development)

slide-25
SLIDE 25

U.S. Department of the Interior U.S. Geological Survey U.S. Department of the Interior U.S. Geological Survey

  • Developed total nitrogen and total phosphorus models for mean annual

conditions in 2002.

  • Local and regional nutrient sources and factors affecting nutrient transport
  • Take advantage of updated GIS data
  • Additional water-quality data from other USGS and outside agency programs

Sites used in National Models Sites being used in Regional Models

Regional SPARROW models-Missouri River Basin

slide-26
SLIDE 26

U.S. Department of the Interior U.S. Geological Survey

Total nitrogen Sources Developed land Point sources Farm fertilizer Manure Atmospheric deposition Land-to-water delivery Precipitation Loess surficial geology (%) Air temperature Irrigated agricultural area (%) Aquatic loss In-stream attenuation Reservoir and lake attenuation

SPARROW model for total nitrogen

Developed land Point sources Farm fertilizer Manure Atmospheric Deposition

slide-27
SLIDE 27

U.S. Department of the Interior U.S. Geological Survey

Total phosphorus Sources Developed land Point sources Farm fertilizer Manure Stream channels (large streams) Land-to-water delivery Precipitation Mean basin slope Permeability Aquatic loss Reservoir and lake attenuation

SPARROW model for total phosphorus

Developed land Point sources Farm fertilizer Manure Stream channels

slide-28
SLIDE 28

U.S. Department of the Interior U.S. Geological Survey

SPARROW Conclusions for Yellowstone Basin

  • Yields of Total Phosphorus (TP) from stream channel
  • Yields of Total Nitrogen (TN) from manure
  • Yellowstone basin had smallest loads and yields of TP and TN

within the Missouri River Basin

  • Lowest percent load of TN (22%) and TP (2%) delivered to the

Mississippi

  • Low load delivery to the Mississippi due to low input, large

reservoirs, and longer travel time

Brown, Juliane B., Lori A. Sprague, and Jean A. Dupree, 2011. Nutrient Sources and Transport in the Missouri River Basin, With Emphasis on the Effects of Irrigation and Reservoirs. Journal of the American Water Resources Association (JAWRA) 47(5):1034-1060. DOI: 10.1111/j.1752- 1688.2011.00584.x

slide-29
SLIDE 29

U.S. Department of the Interior U.S. Geological Survey

Tools to demonstrate results and help guide decisions: SPARROW Decision Support System (DSS)

  • Allows scientists/managers

to visualize SPARROW output

  • Run various scenarios-

predicted load or yield changes with changing nitrogen or phosphorus inputs

http://cida.usgs.gov/sparrow/

slide-30
SLIDE 30

U.S. Department of the Interior U.S. Geological Survey U.S. Department of the Interior U.S. Geological Survey

DSS: Data that can be mapped

  • Model estimates
  • Load
  • Concentrations
  • Yield (load/area)
  • Incremental yield

(incremental yield=load/area for contributing drainage to that reach)

  • Streamflow
  • Model input sources
  • Fertilizer
  • Manure
  • Atmospheric
  • Downstream tracking
  • Total delivered load
  • Incremental delivered load
  • Delivery fraction
  • Incremental delivery yield
slide-31
SLIDE 31

U.S. Department of the Interior U.S. Geological Survey

DSS: Missouri River Basin base map

slide-32
SLIDE 32

U.S. Department of the Interior U.S. Geological Survey U.S. Department of the Interior U.S. Geological Survey

DSS: Zoom into selected areas

  • Total nitrogen loads from all sources (model input)
  • Location of calibration sites
  • Pick list of possible data series
slide-33
SLIDE 33

U.S. Department of the Interior U.S. Geological Survey U.S. Department of the Interior U.S. Geological Survey

DSS: Identify reach by stream name or location

slide-34
SLIDE 34

U.S. Department of the Interior U.S. Geological Survey U.S. Department of the Interior U.S. Geological Survey

DSS: Display detailed information for the reach

slide-35
SLIDE 35

U.S. Department of the Interior U.S. Geological Survey U.S. Department of the Interior U.S. Geological Survey

DSS: Display detailed information

slide-36
SLIDE 36

U.S. Department of the Interior U.S. Geological Survey U.S. Department of the Interior U.S. Geological Survey

DSS: Downstream tracking

  • Total delivered load
  • Incremental delivered load
  • Delivery fraction
  • Incremental delivered yield
slide-37
SLIDE 37

U.S. Department of the Interior U.S. Geological Survey U.S. Department of the Interior U.S. Geological Survey

DSS: Change fertilizer, manure, or atmospheric input

slide-38
SLIDE 38

U.S. Department of the Interior U.S. Geological Survey

DSS: Estimate changes in predicted load

  • Incremental delivered load (percent change from original)
slide-39
SLIDE 39

U.S. Department of the Interior U.S. Geological Survey

DSS: Plots of predicted change in loads

slide-40
SLIDE 40

U.S. Department of the Interior U.S. Geological Survey

DSS: Export data

slide-41
SLIDE 41

U.S. Department of the Interior U.S. Geological Survey

Questions?