Colorado River Basin Characterizing the Colorado River Basin 3 rd - - PowerPoint PPT Presentation

colorado river basin characterizing the colorado river
SMART_READER_LITE
LIVE PREVIEW

Colorado River Basin Characterizing the Colorado River Basin 3 rd - - PowerPoint PPT Presentation

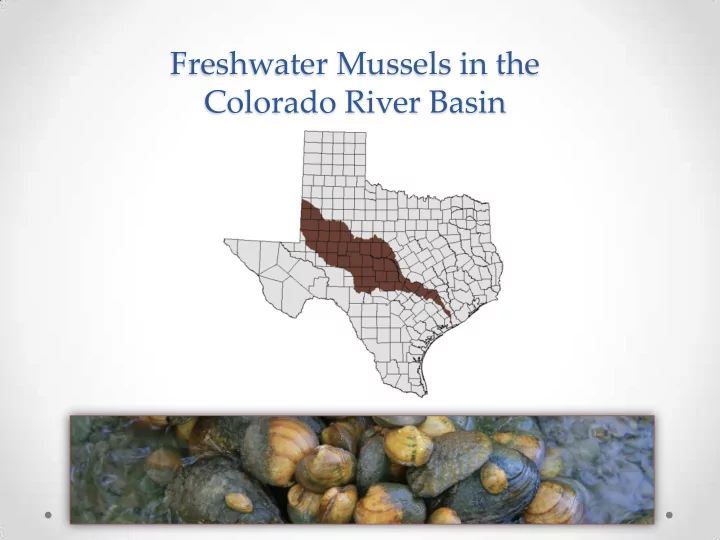
Freshwater Mussels in the Colorado River Basin Characterizing the Colorado River Basin 3 rd largest river basin in Texas Flows from Dawson County to Matagorda Bay Colorado River is 2 nd largest river but only 6 th largest by annual


slide-1
SLIDE 1

Freshwater Mussels in the Colorado River Basin

slide-2
SLIDE 2

Characterizing the Colorado River Basin

  • 3rd largest river basin in Texas
  • Flows from Dawson County to Matagorda Bay
  • Colorado River is 2nd largest river but only 6th largest

by annual flow volume

  • 11 major reservoirs
slide-3
SLIDE 3

Demographics in the Colorado River Basin

  • Population- >2 million
  • Region F- 618,889 (2% of state’s

population)

  • Region K- 1,412,834 (6% of state’s

population)

  • Major cities
  • Odessa, Midland, San Angelo,

Brownwood, Austin, Bay City

  • Recent challenges
  • Rice farmers (Wharton and

Matagorda Counties)

  • Flood control measures (Austin

area)

Regional Water Planning Areas

slide-4
SLIDE 4
slide-5
SLIDE 5

Water Use, Supply, and Demand: Region F

slide-6
SLIDE 6

Water Use, Supply, and Demand: Region K

slide-7
SLIDE 7

Surface Water Quality in the Colorado River Basin

  • 9 watersheds
  • 24 water bodies

listed as impaired (2010 TCEQ)

  • 2 watershed

protection plans initiated

slide-8
SLIDE 8

Fragmentation in the Colorado River Basin

Year 1-100 100-500 500-1000 1000-2000 2000+ 1997 409,729 (n = 10,669) 2,506,869 (n = 10,503) 2,644,220 (n = 3,747) 3,644,885 (n = 2,625) 13,806,334 (n = 2,133) 2002 429,450 (n = 10,957) 2,410,552 (n = 10,263) 2,371,855 (n = 3,366) 3,349,483 (n = 2,407) 12,617,452 (n = 2,006) 2007 459,727 (n = 12,587) 2,503,912 (n = 10,736) 2,275,527 (n = 3,220) 3,219,809 (n = 2,269) 13,383,427 (n = 2,182) Change over 10 years +49,998 ac +1,918 farms

  • 2,957 ac

+233 farms

  • 368,693 ac
  • 527 farms
  • 425,076 ac
  • 356 farms
  • 422,907 ac

+49 farms

slide-9
SLIDE 9

Fragmentation in the Colorado River Basin

slide-10
SLIDE 10

Market Value in the Colorado River Basin

Year $/Acre (Colorado River Basin) $/Acre (Texas Average) 1997 $421 $500 2002 $648 $677 2007 $1,258 $1,196

slide-11
SLIDE 11
slide-12
SLIDE 12

Texas freshwater mussels

  • ~300 mussel species in North America; ~50 species in

Texas

  • Many Texas species are endemic
  • Bottom-dwelling invertebrates
  • Filter-feeders
  • Occur in variety of habitats
  • Most Texas species require free-flowing streams;

some can survive in impounded areas

slide-13
SLIDE 13

Role in aquatic ecosystems

  • Food sources for a variety of insects, fish, birds, and

mammals

  • Remove suspended particles and pollutants from

the water column, helping to improve water quality

  • Indicators of environmental quality
slide-14
SLIDE 14

Primary threats

  • Habitat alteration and degradation
  • Water flow alterations, impoundments
  • Sedimentation
  • Water pollution
  • Invasive species
slide-15
SLIDE 15

Number of species per river basin

23 species in Colorado River Basin

slide-16
SLIDE 16
slide-17
SLIDE 17

Federal listing status

  • Positive 90-day finding for 9 mussels, Dec 15, 2009
  • Positive 90-day finding for 2 mussels, Dec 16, 2009
  • Negative 90-day finding for 1 mussel, March 23,

2010

  • 12-month finding for 5 central Texas mussels, Oct 6,

2011

slide-18
SLIDE 18

Texas Fatmucket Golden Orb Smooth Pimpleback Texas Pimpleback Texas Fawnsfoot

5 Candidate Mussel Species in the Colorado River Basin

slide-19
SLIDE 19

What does all this mean…

What might be impacted with federal listing?

  • Potentially, any activity that pulls water out or puts

water into aquatic system, or that may directly impact the system (e.g., bridge construction)

  • Texas Department of Transportation
  • Existing reservoirs
  • New reservoirs
  • Agricultural activities
  • Power plants
  • Wastewater treatment plants
  • Recreational activities
slide-20
SLIDE 20

The Scenario

  • Population in the Colorado River Basin

continues to increase at predicted rates (e.g. 100% increase in the next 50 years in Lower Colorado)

  • Trends in water demand remain

consistent (e.g. municipal use will eventually surpass irrigation use)

  • All 5 candidate species are listed as

endangered

  • Critical habitat is designated
  • Brazos shiners as reference (stream miles plus a buffer)
slide-21
SLIDE 21

The Response

  • How do we address water quality and quantity

concerns in the Nueces River Basin from a conservation finance perspective?

1. What is the program structure?

  • Who are the players?
  • How does the money flow?

2. What policy changes are needed,?

  • Local, state, federal, none?

3. What is the implementation plan?

  • Who implements?
  • When does implementation occur?

4. How can we scale these ideas up?

  • Can the program be scaled up from river basin

to state or national? 5. What science and analyses is needed?

“Funding Plan”