
SLIDE 1
A Visualization Language
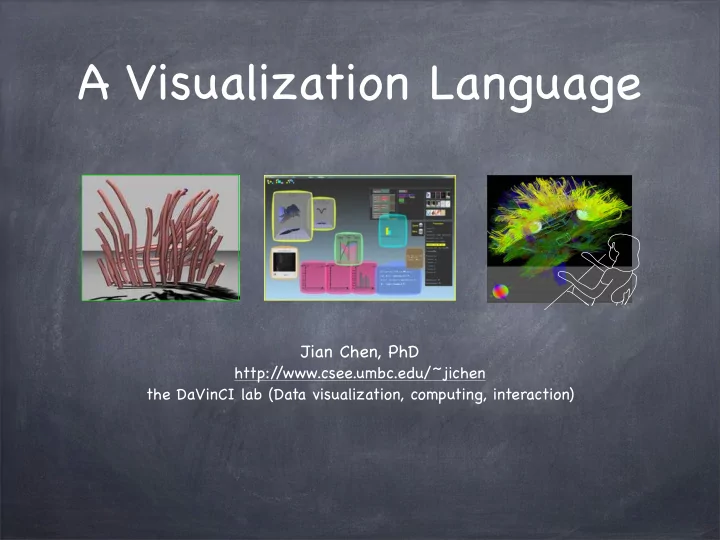
Jian Chen, PhD
http:/ /www.csee.umbc.edu/~jichen the DaVinCI lab (Data visualization, computing, interaction)
A Visualization Language Jian Chen, PhD http:/ - - PowerPoint PPT Presentation
A Visualization Language Jian Chen, PhD http:/ /www.csee.umbc.edu/~jichen the DaVinCI lab (Data visualization, computing, interaction) Research Program Interaction Human-centered computing; Active collaborations Theory of Computational
Jian Chen, PhD
http:/ /www.csee.umbc.edu/~jichen the DaVinCI lab (Data visualization, computing, interaction)
Theory of visualization Computational modeling Interaction
Input device Output device
Visual scene
User’ s tasks
Interaction technique
biology physiology medicine social sciences simulations experiments neurology
Theory of visualization Interactivity
diffusion-tensor MRI visualization
varying bat flight analysis
Descriptive framework of seeing
models
Experiments Knowledge discovery
Collaborators: Computer science: David H. Laidlaw (Brown) Neurology: Alexander P. Auchus (UMMC)
diffusion-tensor MRI visualization
More measurement matrices Not real-time (data intensive)
35 70 2007 2009
Angular separation Retinal variables size color texture value shape position
Figure courtesy of Bertin 1967
Semiotics: the study of sign (Bertin 1967)
7% 8% 10% 11% 29% 35%
Applied to InfoVis by Mackinlay (Stanford, 1986), Fry (MIT/ Harvard, 2006), and Heer (Berkley 2007).
rendering style
Angular variables Retinal variables size color texture value shape position
progress).
depth volume
point, line, area,
flow direction -> color flow speed -> texture size flow direction -> color flow speed -> shape flow speed -> texture size
rendering style
Angular variables Retinal variables size color texture value shape position
depth volume
point, line, area,
Which dimensions are most important? Are these the right level of representation in a problem solving environment?
Goal: study the effect of global illumination on task performance in complex visual scenes.
diffusion-tensor MRI visualization
Descriptive framework of seeing
models
Experiments
Local illumination model (OpenGL) Global illumination model (GI)
Image courtesy of David Banks (Harvard / U. of Tennessee)
GI > OpenGL Motion > No motion Texture > No texture
OpenGL+Texture GI + Texture OpenGL GI
small medium large
rendering style
Angular variables Retinal variables size color texture value shape position
depth volume
point, line, area,
Which dimensions are most important? Are these the right level of representation in a problem solving environment?
Boy’ s surface
Results:
task completion time. tone tone+halo tone+shadow tone+shadow+halo
Research questions:
differences in accuracy and efficiency when we use artistic rendering?
replicate the cueing effects in realistic rendering?
style influence preferences and reassuring brain scientists’ confidences?
Boy’ s surface
2D and 3D integration
quantitative visual dimensions
Visualizations”, (under review).
(under review).
value) > size
diffusion-tensor MRI visualization
varying bat flight analysis
models
Knowledge discovery
Goal: invisible visual interfaces for knowledge discovery
Collaborators:
Computer science: Andrew Bragdon (Microsoft Research), Andy van Dam, David H. Laidlaw Biology: Sharon M. Swartz, Rhea von Busse
Recording @ 1000 fps Playback @ 30 fps ~ 33x slow down Video courtesy of Brown University
Downstroke Upstroke
Extremely complex and dynamic process Work in multiple environments
Error-prone computing Inefficient collaborative social dynamics Education Difficulties in visualization
A multiple-view UI with bubbles (Bragdon et.al 2010) A programming environment for data handling cross- linked to visualization A rapid visualization prototyping (2D/3D rendering) An asynchronous collaborative environment Interactivity
1 2 3 5 6 4 8 7 9 11 12 10
Error-prone computing Inefficient collaborative social dynamics / education Difficulties in visualization
Reduce interruption Consistency
Is there an accessible structure in space usage pattern within the knowledge discovery discourse? How might one exploit this? Answering these questions?
Is inherently multidisciplinary Requires expansive effort and vision Promising great rewards
A key component is mental imagery in discourse.
A swimming bat @ Brown (Video courtesy of the Swartz lab)
Deeper analysis
New applications
Global illumination resulted in similar task performance as local illumination The just-noticeable difference for dense tube visualizations Legible dimensions: color worked the best. Ranking encoding Color encoding Workflow driven interface design
1 2 3 5 6 4 8 7 9 11 12 10
Robert Hester
David H. Laidlaw (Brown) Sharon M. Swartz (Brown) Magenta (Harvard) Kenneth Breuer (Brown) Andries van Dam (Brown) Andrew Bragdon (Microsoft) Bob Zeleznik (Brown) Doug Bowman (VT) Zhigeng Pan (Zhejiang Uni.)
(Texas A&M)
Francis Quek (VT)
Robert Hester (UMC) Alexander P. Auchus (UMC)
Students: Haipeng Cai (MS); Nathaniel Lam (MS); Guangxia Li (MS); Hanyu Liu (MS); Blossom Metevier (BS); Alexander Stachowiak(BS); Shayna Weinstein (MS); Keqin Wu (postdoc); Liming Xu (MS); Guohao Zhang (PhD)
Carl Schmidt (Delware) Fiona McCarthy (Arizona State U.)
NSF:IIS:PI: “Supporting knowledge discovery through a 3D scientific visualization language. ” NSF:ABI:site-PI: “PathBubbles for dynamic visualization of integration of biological information. ” NSF:EPSCoR:Sole-PI: “Storytelling Bubbles: integrating symbolic representation, data ink manipulation, and metaphorical interface for fluid time-varying biological data analysis. ” NSF-DBI (Co-PI), “RCN-UBE Incubator: visual analysis in biology curriculum network. ” Other grants: DHS: Sport security; NSF DUE (TUES): Architecture modeling.
A swimming bat @ Brown (Video courtesy of Swartz lab)
http:/ /www.csee.umbc.edu/~jichen jichen@umbc.edu