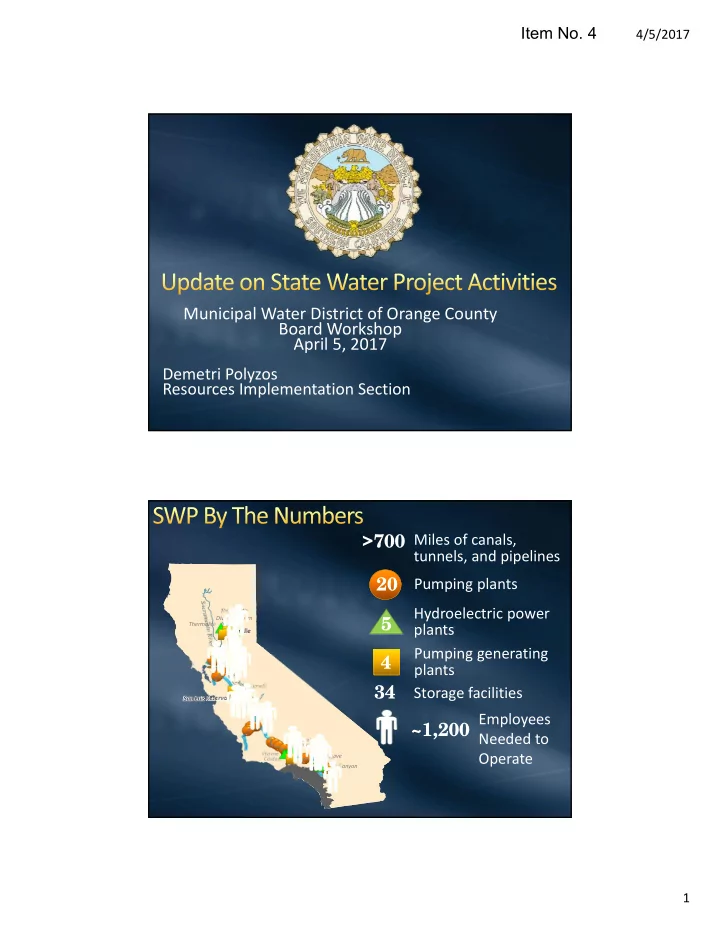
>700 tunnels, and pipelines 20 Pumping plants Hydroelectric - - PDF document

700
SMART_READER_LITE
LIVE PREVIEW

>700 tunnels, and pipelines 20 Pumping plants Hydroelectric - - PDF document

Item No. 4 4/5/2017 Municipal Water District of Orange County Board Workshop April 5, 2017 Demetri Polyzos Resources Implementation Section Miles of canals, >700 tunnels, and pipelines 20 Pumping plants Hydroelectric power Thermalito


slide-1
SLIDE 1

4/5/2017 1

Municipal Water District of Orange County Board Workshop April 5, 2017 Demetri Polyzos Resources Implementation Section

Lake Oroville San Luis Reservoir

Storage facilities

34

Miles of canals, tunnels, and pipelines

>700

Hydroelectric power plants

5

Pumping generating plants

4

Pumping plants

20

Alamo Mojave Devil Canyon Warne Thermalito Diversion Dam Thermalito Hyatt Gianelli Castaic Edmonston

Employees Needed to Operate

~1,200

Item No. 4

slide-2
SLIDE 2

4/5/2017 2

Shasta Lake San Luis Reservoir

By Region

Feather River

County of Butte Plumas County FC&WCD City of Yuba City

North Bay

Napa County FC&WCD Solano County WA

South Bay

Alameda County FC&WCD Zone 7 Alameda County WD Santa Clara Valley WD

San Joaquin Valley

Oak Flat WD County of Kings Dudley Ridge WD Empire West Side ID Kern County WA Tulare Lake Basin WSD

Central Coastal

San Luis Obispo County FC&WCD Santa Barbara County FC&WCD

Southern California

Antelope Valley‐East Kern WA Castaic Lake WA Coachella Valley WD Crestline Lake Arrowhead WA Desert Water Agency Littlerock Creek ID Metropolitan Mojave Water Agency Palmdale Water District San Bernardino Valley MWD San Gabriel Valley MWD San Gorgonio Pass WA Ventura County WPD

Ag M&I M&I

Lake Oroville Shasta Lake San Luis Reservoir

By Contract Amounts (Table A)

Feather River

County of Butte Plumas County FC&WCD City of Yuba City

North Bay

Napa County FC&WCD Solano County WA

South Bay

Alameda County FC&WCD Zone 7 Alameda County WD Santa Clara Valley WD

San Joaquin Valley

Oak Flat WD County of Kings Dudley Ridge WD Empire West Side ID Kern County WA Tulare Lake Basin WSD

Central Coastal

San Luis Obispo County FC&WCD Santa Barbara County FC&WCD

Southern California

Antelope Valley‐East Kern WA Castaic Lake WA Coachella Valley WD Crestline Lake Arrowhead WA Desert Water Agency Littlerock Creek ID Metropolitan Mojave Water Agency Palmdale Water District San Bernardino Valley MWD San Gabriel Valley MWD San Gorgonio Pass WA Ventura County WPD

Ag M&I M&I

Lake Oroville

Metropolitan Kern County WA Everyone Else

31% 24% 46%

Metropolitan’s Table A: 1,911,000 AF

slide-3
SLIDE 3

4/5/2017 3

FY 2016‐2017

34%

27%

5% 3% 7%

24% SWP

O&M Capital Financing

Supply Program Supply Power Demand Management

Contractual obligation to repay actual costs No commodity charge for water Two types of charges: Conservation

Capital ‐ O&M

Transportation

Capital – O&M – Power

Lake Oroville San Luis Reservoir Thermalito Hyatt Gianelli Castaic Edmonston

slide-4
SLIDE 4

4/5/2017 4

Conservation Table A Conservation Table A Transportation Proportional Use of Facilities Factor (PUFF) Transportation Proportional Use of Facilities Factor (PUFF) Power Energy/AF Power Energy/AF

($ millions)

Projected Water Delivery @ 1.24 MAF

$513

$ 152

Variable

$ 225

O&M

$ 137

Capital

slide-5
SLIDE 5

4/5/2017 5

0.00 0.20 0.40 0.60 0.80 1.00 1.20 1.40 1.60 1.80 100 200 300 400 500 600 2006 2007 2008 2009 2010 2011 2012 2013 2014 2015 Million Acre‐Feet Dollars millions Power Charges Fixed Charges Water On Average:

1 MAF $ 450 M

Improved annual budget & project cost control processes Operations Maintenance and Engineering Committee Richardson Audit Increased oversight of regulatory compliance and habitat restoration activities Delta Compliance Programs Committee

slide-6
SLIDE 6

4/5/2017 6

Value Engineering Contract Extension Perris Recovery Wells Design Const. Enterprise Joint Powers Authority Reimbursement Agreement

12

Tunnels SJ River SJ River

Sacramento Sacramento

Sac River Sac River SWP Pumps SWP Pumps CVP Pumps CVP Pumps

12

Proposed Conveyance Proposed Conveyance

12 12

slide-7
SLIDE 7

4/5/2017 7

Shasta Lake San Luis Reservoir Lake Oroville

DWR working to finalize

  • perations for the

remainder of the year San Joaquin Flows

Shasta Lake San Luis Reservoir Lake Oroville

N

OMR reverse (negative) flows Delta Map

Exports

Banks and Jones PP

Direct flow to pumps Sacramento River Flow San Joaquin River Flow

Sacramento Stockton

Old/Middle Rivers

slide-8
SLIDE 8

4/5/2017 8

Flows expected to remain high through Spring

  • Above Normal Snowpack
  • CVP Reservoirs already

making flood control releases

  • Similar conditions as 2011

where high flows continued into July

Shasta Lake San Luis Reservoir Lake Oroville

Water Year to Date Water Year to Date

  • Metropolitan has

received ~43,000 AF of Article 21 supplies

  • Limited during Clifton

Court outage in April

  • Anticipate ~100,000 AF
  • f additional deliveries

starting in May

Fill San Luis Reservoir Meet Contractor Demands Excess Export Capacity FEB‐MAR APR APR‐JUN

slide-9
SLIDE 9

4/5/2017 9

0.0 0.5 1.0 1.5 Million Acre‐Feet

60% SWP Allocation 70% SWP Allocation

~ 722 TAF ~ 913 TAF

~ 100 TAF Anticipated Additional A21 Supplies 1.0 – 1.2 MAF Estimated Storage Put Capacity 700 TAF Max Historic Put (2011)

1.8 1.1 1.0 1.7 2.4 2.7 2.3 1.2 0.9 1.3 1 2 3 4 5

2007 2008 2009 2010 2011 2012 2013 2014 2015 2016 2017 Million Acre‐Feet

Emergency Storage Dry‐Year Storage

End of Year Balances

2.0 MAF 2.2 MAF

slide-10
SLIDE 10

4/5/2017 10

SWP is not perfect, but it delivers Metropolitan stands ready to assist the Department of Water Resources Continue to look for opportunities to influence decision making and reduce costs Focus is on water supply reliability and smart water management