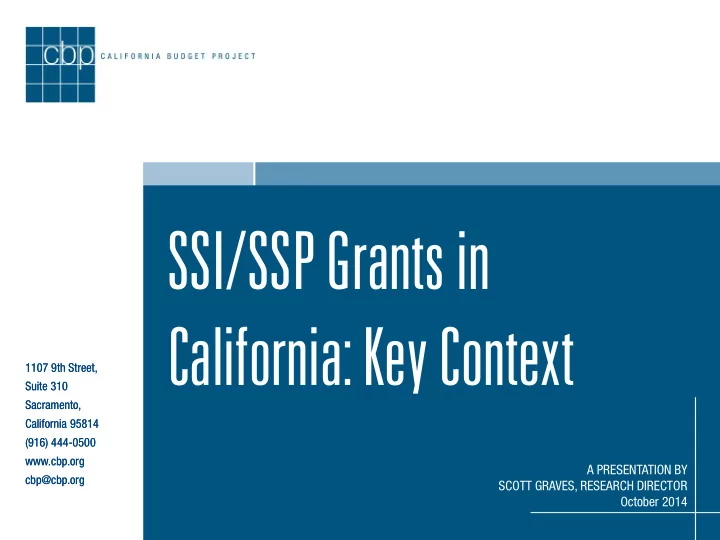
ssi ssp grants in california key context
play

SSI/SSP Grants in California: Key Context 1107 9th Street, 1107 - PowerPoint PPT Presentation

SSI/SSP Grants in California: Key Context 1107 9th Street, 1107 9th Street, Suite 310 Suite 310 Sacramento, Sacramento, California 95814 California 95814 (916) 444-0500 (916) 444-0500 www.cbp.org www.cbp.org A PRESENTATION BY


  1. SSI/SSP Grants in California: Key Context 1107 9th Street, 1107 9th Street, Suite 310 Suite 310 Sacramento, Sacramento, California 95814 California 95814 (916) 444-0500 (916) 444-0500 www.cbp.org www.cbp.org A PRESENTATION BY cbp@cbp.org cbp@cbp.org SCOTT GRAVES, RESEARCH DIRECTOR October 2014

  2. Key Facts About SSI/SSP Grants  Supplemental Security Income/State Supplementary Payment (SSI/SSP) grants help 1.3 million low-income seniors and people with disabilities in California pay for food, housing, and other basic living expenses.  SSI/SSP cash assistance is provided to individuals and couples. The maximum grant is based on a number of factors, including whether recipients live independently.  Grants are funded with both federal (SSI) and state (SSP) dollars. In 2014-15, federal support will total $7.2 billion and state support will total $2.5 billion . 2

  3. State Policymakers Have Reduced SSI/SSP Grants  Over a number of years, state policymakers reduced SSI/SSP grants in order to decrease the state’s costs for the program. State policymakers: – Suspended the annual state cost-of-living adjustment (COLA) for SSI/SSP grants several times prior to 2010-11. – Eliminated the state COLA starting in 2010-11. – Cut the state (SSP) portion of the grants, reducing it to the minimum allowed by federal law for both individuals and couples. 3

  4. SSI/SSP Grants Remain Below the January 2009 Level 4

  5. SSI/SSP Grants for Individuals Remain Below the January 2009 Level, Even Without Adjusting for Inflation State Policymakers Cut the SSP Portion of the Grant From $233 in 2009 to $156 by 2012 $1,000 $907 $881 $877 $900 Individuals Who Are Elderly or Have Disabilities $800 Maximum Monthly SSI/SSP Grant for $700 $600 $674 $721 $725 $710 $674 $674 $698 $500 $400 $300 $200 $233 $100 $171 $171 $156 $156 $156 $156 $0 January 2009 January 2010 January 2011 January 2012 January 2013 January 2014 January 2015* State Portion (SSP Grant) Federal Portion (SSI Grant) * Reflects a projected 0.5 percent federal cost-of-living adjustment (COLA) to the SSI portion of the grant effective January 1, 2015. The annual state COLA for SSI/SSP grants was eliminated starting in 2010-11. Source: Department of Social Services 5

  6. SSI/SSP Grants for Couples Remain Below the January 2009 Level, Even Without Adjusting for Inflation State Policymakers Cut the SSP Portion of the Grant From $568 in 2009 to $396 in 2010 $1,800 $1,579 $1,600 $1,478 $1,483 Couples Who Are Elderly or Have Disabilities $1,400 Maximum Monthly SSI/SSP Grant for $1,200 $1,011 $1,000 $1,082 $1,087 $1,066 $1,048 $1,011 $1,011 $800 $600 $400 $568 $200 $396 $396 $396 $396 $396 $396 $0 January 2009 January 2010 January 2011 January 2012 January 2013 January 2014 January 2015* State Portion (SSP Grant) Federal Portion (SSI Grant) * Reflects a projected 0.5 percent federal cost-of-living adjustment (COLA) to the SSI portion of the grant effective January 1, 2015. The annual state COLA for SSI/SSP grants was eliminated starting in 2010-11. Source: Department of Social Services 6

  7. SSI/SSP Grants Have Declined as a Share of the Federal Poverty Line 7

  8. SSI/SSP Grants for Individuals No Longer Lift Seniors and People With Disabilities Above the Federal Poverty Line 110% 100.6% 100.4% 100.5% 100% 93.6% 93.1% Maximum Monthly SSI/SSP Grant for Individuals Who Are Elderly or Have Disabilities as a Percentage of the Federal Poverty Line 91.8% 90.5% 90.2% 90% 80% 70% 60% 50% 40% 30% 20% 10% 0% January 2007 January 2008 January 2009 January 2010 January 2011 January 2012 January 2013 January 2014 Source: Department of Social Services and US Department of Health and Human Services 8

  9. SSI/SSP Grants for Couples Have Been Declining as a Share of the Federal Poverty Line 140% 131.7% 130.6% 130.0% 120% 115.9% 114.8% 114.5% or Have Disabilities as a Percentage of the Federal Poverty Line 113.1% Maximum Monthly SSI/SSP Grant for Couples Who Are Elderly 112.8% 100% 80% 60% 40% 20% 0% January 2007 January 2008 January 2009 January 2010 January 2011 January 2012 January 2013 January 2014 Source: Department of Social Services and US Department of Health and Human Services 9

  10. SSI/SSP Grants Have Lost About One-Third of Their Purchasing Power During the Past 25 Years 10

  11. Without Adjusting for Inflation, SSI/SSP Grants for Individuals Are About $250 Per Month Higher Than in 1989-90 $1,400 $1,200 Individuals Who Are Elderly or Have Disabilities Maximum Monthly SSI/SSP Grant for $1,000 $881 $800 $630 $600 $400 $200 $0 * Reflects a projected 0.5 percent federal cost-of-living adjustment (COLA) to the SSI portion of the grant effective January 1, 2015. The annual state COLA for SSI/SSP grants was eliminated starting in 2010-11. Source: Department of Social Services 11

  12. After Adjusting for Inflation, SSI/SSP Grants for Individuals Are About One-Third Lower Than in 1989-90, a Loss of More Than $400 Per Month $1,400 $1,299 $1,200 Individuals Who Are Elderly or Have Disabilities Maximum Monthly SSI/SSP Grant for Loss of purchasing power since 1989-90 = $1,000 32% $630 $881 $800 $600 $400 $200 $0 Grant Level if Grant Had Been Fully Adjusted for Inflation Each Year Actual Grant * Reflects a projected 0.5 percent federal cost-of-living adjustment (COLA) to the SSI portion of the grant effective January 1, 2015. The annual state COLA for SSI/SSP grants was eliminated starting in 2010-11. Source: CBP analysis of Department of Finance and Department of Social Services data 12

  13. Housing Costs Are a Significant Concern for SSI/SSP Recipients, Even in Counties That Are Considered to Be More Affordable 13

  14. Fair Market Rent for a Studio Apartment in Federal Fiscal Year 2014 $1,000 $1,200 $200 $400 $600 $800 $0 Marin San Francisco San Mateo Orange Santa Clara Alameda Contra Costa Santa Cruz San Diego Mono Santa Barbara All 58 Counties and Is Higher Than the Entire Grant in 13 Counties Studio Apartment Rent Exceeds One-Half of the SSI/SSP Grant in Ventura Los Angeles Monterey Napa Sonoma San Luis Obispo Nevada Inyo Riverside San Bernardino Yolo Solano Shasta Source: Department of Social Services and US Department of Housing and Urban Development El Dorado Placer Sacramento San Benito Trinity Calaveras Alpine Humboldt Lassen Mendocino Lake Del Norte Fresno Sierra Amador Kern Glenn Colusa San Joaquin Madera Stanislaus Tuolumne Mariposa Tulare Maximum SSI/SSP grant Kings for an individual as of Plumas January 1, 2014 = Merced SSI/SSP grant 50% of the Siskiyou Butte $877 Imperial Sutter Yuba Tehama 14 Modoc

  15. Boosting SSI/SSP Grants Would Require Changing the State’s Budget Priorities 15

  16. A Legislative Proposal to Restore the Annual State COLA for SSI/SSP Grants Failed in 2014  As part of the 2014-15 state budget process, the Assembly proposed to restore the state COLA for SSI/SSP grants starting on April 1, 2015. This proposal would have: – Boosted the SSP portion of the grant from $156 to $160 for individuals and from $396 to $405 for couples . – Increased state General Fund costs by between $70 million and $80 million in 2015-16, according to the Legislative Analyst’s Office (LAO).  This change was not included in the 2014-15 budget. 16

  17. The Assembly Proposal Was Modest Compared to the Size of the Cuts the State Has Made to SSI/SSP Grants  The Assembly’s proposal would have increased the SSP portion of the grant for an individual by $4 per month starting in April 2015.  However, the SSP portion of this grant would have to increase by nearly $100 per month in order to bring the total SSI/SSP grant up to the federal poverty line in 2014. 17

  18. The State's Share of the SSI/SSP Grant Would Have to Increase by Nearly $100 Per Month to Bring the Total Grant Up to the 2014 Federal Poverty Line Federal poverty line for $1,100 an individual in 2014 $973 $1,000 $877 $900 $252 $800 $156 $700 $600 $500 $400 $300 $200 $100 $0 Maximum Monthly SSI/SSP Grant SSI/SSP Grant if State Portion Were Increased to for an Individual in 2014 Bring the Total Grant Up to the 2014 Federal Poverty Line Federal Portion (SSI Grant) State Portion (SSP Grant) Source: Department of Social Services and US Department of Health and Human Services 18

  19. The Cost of the Assembly Proposal Was Modest Compared to the Cost of the State’s Film Tax Credit  Restoring the annual state COLA for SSI/SSP grants would increase state General Fund spending by up to $80 million in 2015-16, according to the LAO.  In contrast, the state’s tax credit for film and television productions, which was recently expanded by AB 1839, will cost the state $330 million in foregone revenues each year from 2015-16 through 2019-20. – Research suggests that this type of business tax incentive does little to create jobs and simply provides a windfall for employers. 19

  20. The Measure of a Good Budget  A good budget should take a balanced approach that strives for: – Improving outcomes for individuals, families, and communities. – Investing in long-term economic growth and broadly shared prosperity. – Paying down debt and saving for a rainy day. 20

  21. For More Information Scott Graves Director of Research 916-444-0500 sgraves@cbp.org www.cbp.org Blog: www.CaliforniaBudgetBites.org Twitter: @CABudgetProject Facebook.com/CAbudget 21

Download Presentation
Download Policy: The content available on the website is offered to you 'AS IS' for your personal information and use only. It cannot be commercialized, licensed, or distributed on other websites without prior consent from the author. To download a presentation, simply click this link. If you encounter any difficulties during the download process, it's possible that the publisher has removed the file from their server.

Recommend


More recommend