
SLIDE 1
1
- 7. Two Random Variables
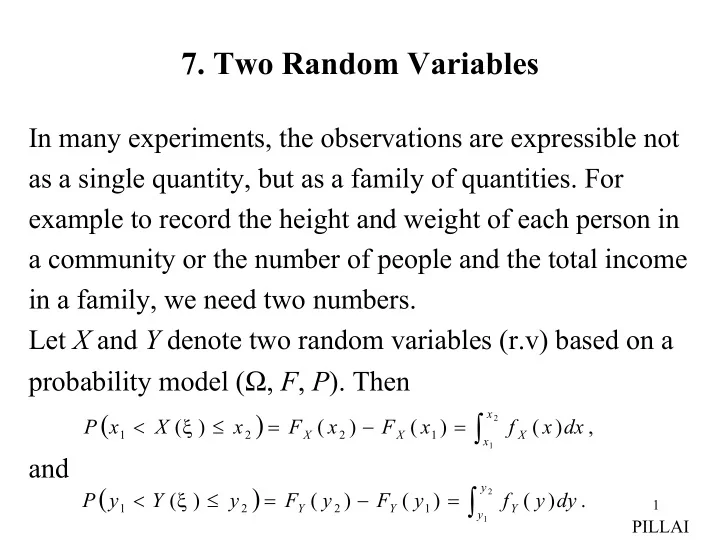
In many experiments, the observations are expressible not as a single quantity, but as a family of quantities. For example to record the height and weight of each person in a community or the number of people and the total income in a family, we need two numbers. Let X and Y denote two random variables (r.v) based on a probability model (Ω, F, P). Then
( )
∫
= − = ≤ <
2 1
, ) ( ) ( ) ( ) (
1 2 2 1 x x X X X
dx x f x F x F x X x P ξ
and
( )
. ) ( ) ( ) ( ) (
2 1
1 2 2 1
∫
= − = ≤ <
y y Y Y Y
dy y f y F y F y Y y P ξ
PILLAI