
SLIDE 1
1
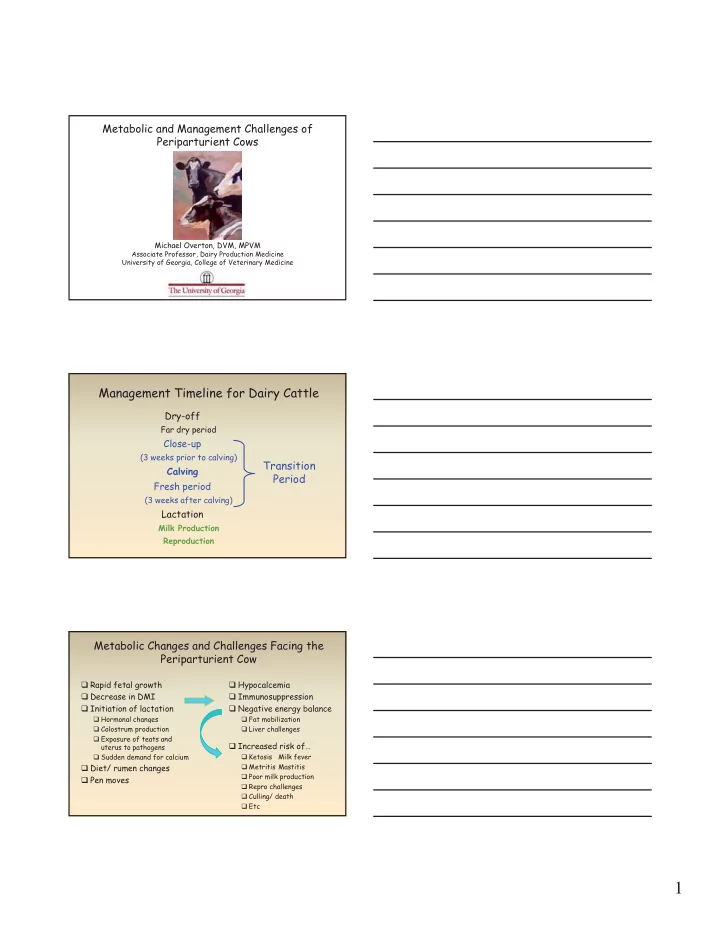
Metabolic and Management Challenges of Periparturient Cows
Michael Overton, DVM, MPVM
Associate Professor, Dairy Production Medicine University of Georgia, College of Veterinary Medicine
Denise Rich – therichartist.com
1 Key Points for This Presentation Transition cows undergo extreme - - PDF document
Metabolic and Management Challenges of Periparturient Cows Denise Rich therichartist.com Michael Overton, DVM, MPVM Associate Professor, Dairy Production Medicine University of Georgia, College of Veterinary Medicine Management Timeline
Denise Rich – therichartist.com
Energy (glucose) and calcium needs dramatically increase
Excessive mobilization of fat presents challenges to the
(Bauman and Currie, 1980; Bauman, 2000; Ingvartsen and Andersen, 2000)
Rumen: size absorptive capacity rate of nutrient absorption Adipose Tissue: lipolysis de novo fat synthesis uptake of preformed fatty acids re-esterification of fatty acids Liver: size rate of gluconeogenesis protein synthesis ketogenesis Muscle: glucose utilization protein synthesis protein degradation Mammary gland: # secretory cells nutrient use supply of blood
Very little glucose available for absorption Most is modified (fermented) by rumen microbes Cows are very dependent on gluconeogenesis for
Propionate
Propionate
~ 30 to 70%
Amino acids (Alanine)
Up to ~ 30%
Lactate
Up to ~ 15%
Glycerol
Normally, very small
amounts
“Free” fatty acids (NEFA’s) circulating in blood Glycerol
Fatty acid ß-oxidation:
Provides ATP for glucose synthesis Stimulates gluconeogenesis from lactate and alanine (via acetyl-CoA
ß-Oxidation: pathway that sequentially removes two-carbon
Complete combustion (oxidation) of NEFA generates Acetyl-Co A
If Krebs Cycle gets overloaded, acetyl Co A is shunted off to
Fetal metabolic rate (weight-specific oxygen consumption) ~
Most energy and nitrogen needs of the fetus for growth/
Glucose uptake – passive AA uptake via active placental transport (independent of maternal
During hypoglycemia, fetus makes up by using more AA for energy
Fetus cannot take direct advantage of mobilized maternal
Ex: 13 kg to 9 kg
Mobilize amino acids from extrahepatic tissues Stimulate gluconeogenesis, particularly in the liver
Results in the production of glucose from amino acids
Inhibits uptake of glucose by muscle and fat tissue
Tries to conserve glucose (glucose-sparing effect)
Stimulates the breakdown of fat
The fatty acids released by lipolysis are used for production of
deficiencies:
immunologic stress
Goff and Horst, 1997
A cow producing ~ 2.5 gallons colostrum loses ~ 23 g Ca
~ 9 X the total plasma level of Ca in a cow To make up the difference, cows need to absorb more
Within a few days of calving, mammary requirements are
Glucose
Amino acids
Fatty acids
Total “Energy”
Despite these needs, feed intake is low
Negative energy balance: -10 to -15 Mcal/ d (or more) Negative protein balance: - 500 to -600 g/d (or more)
Adapted from T.R. Overton, 2001
The liver actually increases in size and metabolic activity
Glucose release from liver increases from ~ 1300 g/d at
Bell, 1995 and Reynolds et al, 2000
Cow’s body shifts more toward energy utilization from circulating
Liver Muscle Fat Carbohydrate Metabolism Glucose uptake, Glycogen synthesis X X X Glycogenolysis X X X Gluconeogenesis X Fat (Lipid) Metabolism Lipogenesis X X Lipolysis X X Protein Metabolism Amino acid uptake X Protein synthesis X Protein degradation X Gluconeogenesis X
Since mammary gland does not require insulin for
Mammary receptors up-regulated, adipose and other
Gluconeogenic efforts from the liver Antagonizes insulin – creates “insulin resistance” Utilization of glucose by “non-essential” tissues
M.C. Lucy, Reprod Dom Anim, 2008
Low insulin and low IGF-1:
Lypolysis – breakdown of fat Increase in NEFA’s Repartitioning of nutrients – spare glucose for mammary gland for
Reduced GnRH / LH secretion Reduced ovarian responsiveness to gonadotropins
If transition mgmt/ cow health are good, temporary issue If mgmt is poor, leads to compromised liver function and
Lance Baumgard, 2007
Lance Baumgard, 2007
Released by peripheral tissues Contribution toward gluconeogenesis is limited by their
Drackley et al., 2001
Function Metabolic Change Tissues Affected Milk Synthesis Use of nutrients (partitioning) Mammary Lipid Metabolism Lipolysis, Lipogenesis Adipose tissue Glucose Metabolism Gluconeogenesis, Glycogenolysis Liver Use of glucose, Use of lipids for energy Body tissues Protein Metabolism Mobilization of protein sources Muscle Mineral Metabolism Absorption and mobilization of calcium Kidney, liver, gut, and bone (Bauman and Currie, 1980)
Catabolism
Fats
Hormone-sensitive Lipase Stimulated by:
Fats “Free” fatty acids
Glycerol Amino acids – from
Stimulated by: Epinephrine Norepinephrine Glucagon Thyroxine Inhibited by: Insulin
Bell, 1995
Complete oxidation to
Partial oxidation to ketone
Acylglycerol synthesis and
Limited ability to export out
Minor option – secretion in
(Encyclopedia of Animal Science by Wilson G. Pond & Alan W. Bell, Published by CRC Press, 2005)
Incomplete oxidation (Ketones) Re-esterification (triglycerides)
VLDL’s
Continued/ excessive
Too many C-2 compounds
A mismatch of Acetyl-CoA
Additional Acetyl-CoA is
Result – ketosis and
(van Knegsel et al., 2005)
Propionate
~ 30 to 70%
Amino acids (Alanine)
Up to ~ 30%
Lactate Lactose (milk) Fetus Nervous tissue Other energy needs Lactate
Up to ~ 15%
Glycerol
Normally, very small
amounts
gy
(Review by Emery et al., 1992)
Reduce stress
Causes increased
Body fat NEFA Fat NEFA NEFA Liver Insulin Epi
+
Causes increased fat
Increase insulin
Decreases lipolysis Promotes lipogenesis Fat TG Fat VLDL Ketone Bodies Milk Fat Mammary Gland CO2 Propionate Mitochondrial Fuel use Glucose (precursors)
Cow modify how their body metabolizes glucose
Changes in whole-body metabolism Liver-specific adaptations for glucose synthesis Increased reliance on amino acids for glucose production Increased reliance on amino acids for glucose production
Fat mobilization and resulting NEFA’s present challenges to
Management needs to focus on ways to improve metabolic
Minimize risk of excessive fat mobilization Improve supply-side manipulations