
SLIDE 1
1/23/2017 1
WRRF 15‐01
POTABLE REUSE RESEARCH COMPILATION: SYNTHESIS OF FINDINGS
January 23, 2017 1:00 pm – 2:30 pm ET
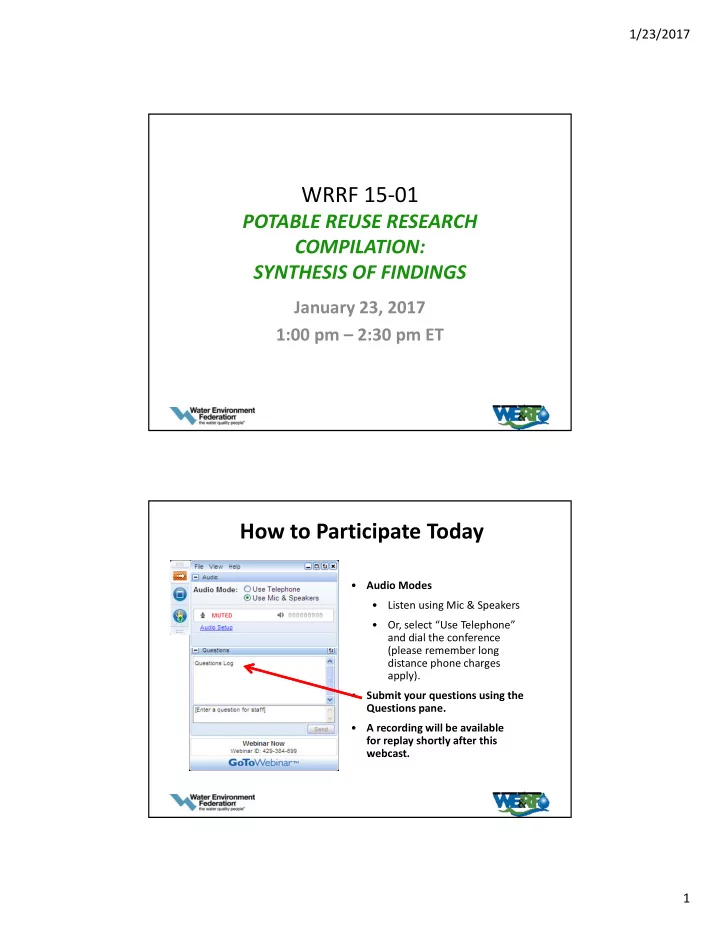
How to Participate Today
- Audio Modes
- Listen using Mic & Speakers
- Or, select “Use Telephone”
and dial the conference (please remember long distance phone charges apply).
- Submit your questions using the
Questions pane.
- A recording will be available
for replay shortly after this webcast.