
SLIDE 1
www.worldpop.org Uses of small area demographic data Planning - - PowerPoint PPT Presentation
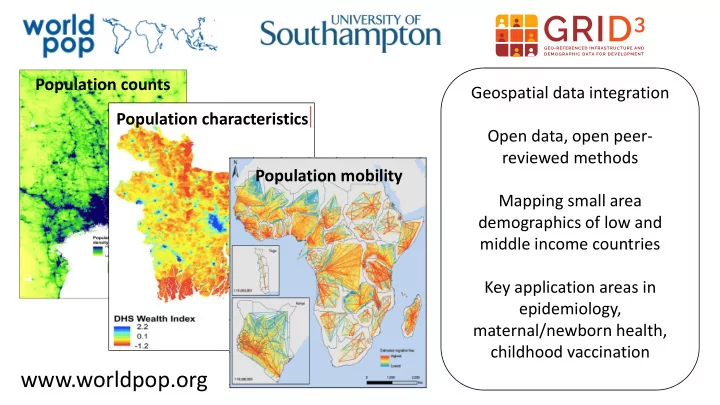
Population counts Geospatial data integration Population characteristics Open data, open peer- reviewed methods Population mobility Mapping small area demographics of low and middle income countries Key application areas in epidemiology,
Loveridge A. <al2g14@soton.ac.uk> Loveridge A. <al2g14@soton.ac.uk> Loveridge A. <al2g14@soton.ac.uk> Loveridge A. <al2g14@soton.ac.uk> Mapping populations Mapping key demographic groups Mapping access, use and quality of healthcare Mapping health service utilization
Buildings, schools, roads, markets, conflicts Household sizes, neighbourhood types, poverty rates
> 30 People Per Ha
> 30 People Per Ha
www.worldpop.org Sorichetta et al (2017) Nature Sci Data; Gaughan et al (2017) Nature Sci Data
Age structure WoCBA Fertility data Population Births Pregnancies
Source: James, W.H.M et.al. (2018). Gridded births and Pregnancy Datasets for Africa, Latin America and the Caribbean. Scientific Data 5 (18890)
Source: James, W.H.M et.al. (2018). Gridded births and Pregnancy Datasets for Africa, Latin America and the Caribbean. Scientific Data 5 (18890)
Alegana et al (2019), National and sub-national variation in patterns of febrile case management in sub-Saharan Africa, Nature Communications
Travel times to (a) Hospitals, (b) Health centres and (c) Clinics/Health posts/Dispensaries
Source: Wigley et al., Evaluating the Suitability of Indicators for Measuring the Variability and Geographical Accessibility of Maternal Health Services across Sub-Saharan Africa (Under review)
Figure 1 - Map (a) showing the estimated number of pregnancies in 2015 per 1km²,24 and map (b) showing travel-time to the nearest hospital
Ruktanonchai C.W., et al (2016). Equality in Maternal and Newborn Health: Modelling Geographic Disparities in Utilisation of Care in Five East African Countries. PLOS ONE 11 (10) Fig 4. Births adjusted probability maps representing the probability of obtaining MNH care for a given birth at the administrative II unit in Kenya, Tanzania, Uganda, Burundi and Rwanda.
www.worldpop.org
@WorldPopProject
@AndyTatem