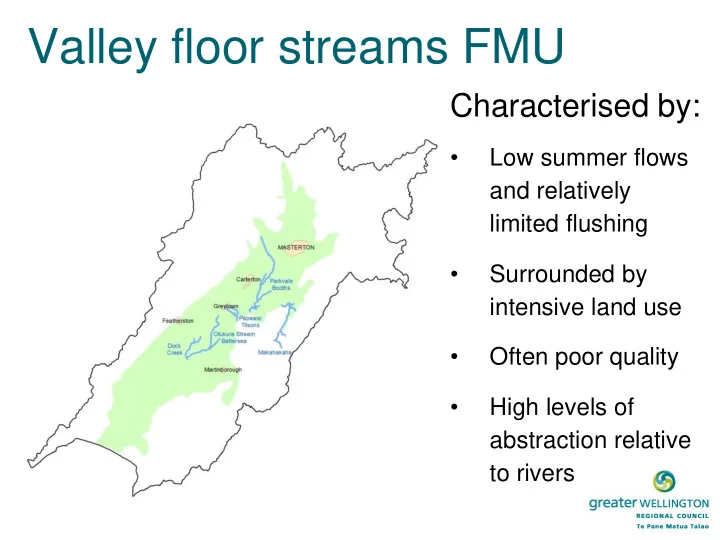

Valley floor streams FMU Characterised by: • Low summer flows and relatively limited flushing • Surrounded by intensive land use • Often poor quality • High levels of abstraction relative to rivers
Allocation limits - what to do? Three choices for WIP: 1. Continue the current default limits (proposed in the NRP) 2. As above but also include recommendations for further work to deliver more robust limits within set time frame 3. Recommend new limits (+ rationale).
Flow is a defining feature of streams • Flow a “master variable” in streams. • Influences many aspects of stream ecology, including: – Channel form – Transport of sediment, nutrients and food down a river system – and the distribution and behaviour of organisms.
Understanding the flow regime • Must consider the whole flow regime – How much? (Magnitude) Spawning Migration – How often? (Frequency) – How long? (Duration) Adult rearing – When? (Timing) – How quick? (Rate of change) • Different aspects of the flow regime have different ecological & geomorphological functions
What happens when you reduce flows? Reduced connectivity Sediment deposition increased Excessive macrophyte growth Less habitat Migration cues lost Proliferation of algae Spawning habitat inaccessible Increased water temperatures Reduced reaeration Lower dilution of contaminants
take Groundwater input Monitoring site
Groundwater input take Monitoring site
Key Components of flow management (required by NPS-FM) • Minimum flow is the flow at which abstraction must be restricted or cease – Provides refuge for instream values during periods of low flow • Allocation limit is the rate (or volume) that water can be extracted – Protects instream values by controlling length of low flow period and maintaining some flow variability – Maintains reliability of supply to abstractors
Technical assessment methods • Historical flow methods Assume status quo is best Assume linear response to flow Non-specific Easily applied • Generalised habitat modelling • Hydraulic habitat modelling Assumes habitat (or WQ) is limiting Non-linear flow response • Water quality modelling Linked with specific values Data hungry Expensive • Ecohydraulics modelling Controversial • ++ many more
Protection levels • Risk management • High value then accept minimal risk – minimum flow provides 90-100% habitat retention at naturalised MALF – allocation limit 10-20% of MALF • Lower value then accept more risk – minimum flow provides 70-80% habitat retention at naturalised MALF – allocation limit 20-30% of MALF
Common approaches in other regions • Historical flow methods to guide broad-scale flow management decisions • Detailed instream habitat analysis for rivers with very high values and/or large flow alteration • Protection levels based on risk assessment • Allocation limits set based on security of supply
Thinking about over-allocation • NPSFM defines over-allocation as: – When the water resource has been allocated beyond a limit; or Why is this – When the water resource is being used to a point where a freshwater objective is no longer being met important? • BUT little guidance on the spatial and temporal resolution at which limits or objectives should apply
Thinking about over-allocation • Freshwater values vary in space & time • Water resource availability varies in space & time • Water resource use varies in space & time • Need to consider how to balance spatial (& temporal) variations in values, objectives & implementation of limits Predicted distribution of • Uniform rules don’t result in uniform longfin eel Proposed outcomes NES ‘large river’ rules • Same limit implemented in different ways can have different consequences
Parkvale Stream Duration of low flows
Parkvale Stream Duration of low flows
Existing practice
Different application of rules leads to different outcomes Description Shut-off Allocation rate Treatment of cumulative occurs when at each take effects Δ Q max i = 0.5 Strategy 1 Each take is Q t i < Q min i None for allocation rate, but considered in isolation MALF i catchment allocation to all others and is increases and reliability controlled by flow at reduces downstream of each that take. new take. Δ Q max i = 0.5 Strategy 2 Minimum flows are Q tC < Q minC None for allocation rate, but controlled at catchment MALF i catchment allocation outlet. Allocation rate increases and reliability for each take is related reduces downstream of each to hydrology at the new take. take. Δ Q max i = Strategy 3 Minimum flows are Qt C < Q minC Total catchment allocation is Δ Q maxC / n controlled at catchment limited, but allocation rate for outlet. Total catchment all existing takes is altered allocation is split with the addition of each new equally between each take. take regardless of hydrology.
Number of takes Average change in flow (m3/s) Average change in flow (m3/s) Number of takes Number of over-allocated reaches Number of over-allocated reaches
Recommend
More recommend