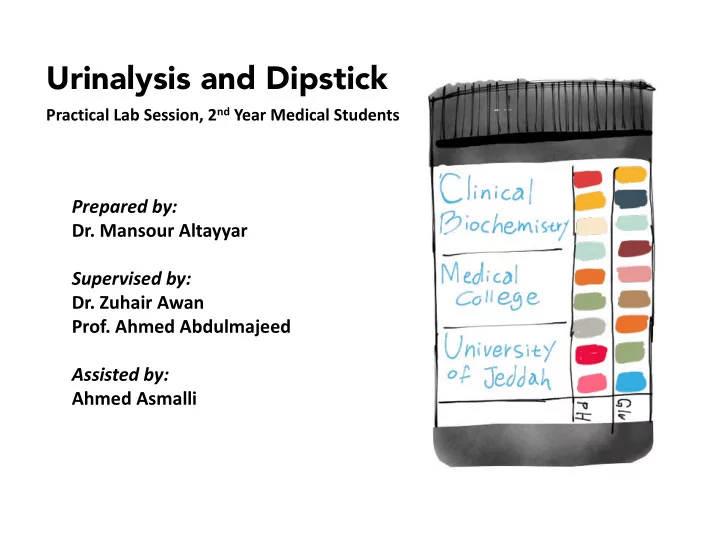
SLIDE 1 Urinalysis and Dipstick
Practical Lab Session, 2nd Year Medical Students
Prepared by:
Supervised by:
- Dr. Zuhair Awan
- Prof. Ahmed Abdulmajeed
Assisted by: Ahmed Asmalli
SLIDE 2 Introduction
- Compounds, cells, bacteria, stones, crystals and other elements
can be passed through the urine which may reflect a special mode of health state.
- A urine sample can be evaluated:
Physically by direct visualization. Microscopically by Light and electron microscope Chemically Urine dipstick and
tools.
SLIDE 3 1- Physically
- Physical changes of the urine can be evaluated directly by the
examiner in a clear urine container: Color Clarity Odor Pale Yellow Dark Yellow Red Orange Green Blue Black Clear or Turbid Ammonia “Fishy” Acetone “Sweet” Sulfuric
SLIDE 4
2- Microscopically
Some artifacts that are not visible grossly can be determined under the microscope: Cells Stones Crystals Bacteria Parasite
SLIDE 5 3- Chemically
- A group of compounds can pass through the urine and may
reflect physiologic and/or pathologic state of health that can not be figured grossly or by microscopy.
- A Reagent strip “Dipstick”, can reveal the presence of these
compounds when they chemically react with reagents on the strip.
- Urine Dipsticks are equipped in most clinics, emergency
units and hospital wards.
- They can be done and read by 2 minutes, this provide a
swift preliminary evaluation of the patient for a subsequent action and that makes the urine dipstick a point-of-care-test (POCT).
SLIDE 6
Urine Dipstick
Description: A narrow strip with multiple colored pads glued on it, each pad contains a reagent that reacts with a specific element in the urine which will reveal its presence by changing its color. The tested elements are: The colors can be evaluated visually and compared to a chart usually presented on the container . GLU BIL KET SG BLD pH PRO URO NIT LEU Reagent pad-free area (Hold here).
SLIDE 7
Urine Dipstick
Test Method Important considerations before conducting the test: 1- Always check the expiration date on the container. 2- Clean hands and wear gloves. 3- Preform test in an area with good light. 4- Before starting the test, compare the pads on the negative color chart and make sure they match. 5- Strips should be kept in their container all the time and keep them away from extreme temperature, moisture, sunlight and harsh substances to ensure that the reactivity of the reagent is intact.
SLIDE 8
Urine Dipstick
Test Method 1- Be prepared, be protective: B- Bench preparation. L- Lighting accommodation. T- Time management. G- Gloves.
SLIDE 9
Urine Dipstick
Test Method 2- Obtain fresh urine (1 hour old maximum or refrigerated), well-mixed, un-centrifuged, in a clear container.
SLIDE 10
Urine Dipstick
Test Method 3- Hold the strip at a pad-free area and care not to touch the pads.
SLIDE 11
Urine Dipstick
Test Method 4- Dip the strip in the urine completely and remove it immediately while sliding its side on the container’s edge to remove excess urine, or you can tap it on a clean tissue.
SLIDE 12
Urine Dipstick
Test Method 5- With the respect of time indicated on the color chart, hold the strip and compare colors. Document your observation, discard strip.
SLIDE 13
Urine Dipstick
Results and Interpretations 1- pH Interpretation: By range from 5 – 8.5. Read at: 60 sec Low pH in: High protein diet and acidosis. High pH in: Low protein diet, alkalosis and some strains of bacteria. Alterations in results: False +Ve (high pH) in: Contamination from microorganism.
SLIDE 14
Urine Dipstick
Results and Interpretations 2- Specific Gravity (SG) Interpretation: By range from 1.000 – 1.030. Read at: 45 sec Low SG: Excess water intake, renal tubule dysfunction and Diabetes Insipidus. High SG: Low water intake and volume depletion. Alteration in Results: False +ve: Contamination during collection and/or storing.
SLIDE 15 Urine Dipstick
Results and Interpretations 3- a - Occult Blood. Interpretation: Read at: 60 sec
- ve: no RBC, hemoglobinuria or myoglobinuria.
Non-Hemolyzed trace: Intact RBC bounded to the pads giving the unique pattern of blue dots over orange pad. Few (25 or 1+). Medium (80 or 2+). Large (200 or 3+).
SLIDE 16
Urine Dipstick
Results and Interpretations 3- b - Occult Blood. Causes: Stones – Tumor – Glomerulonephritis – Trauma – Anemia…etc. Alteration in Results: False +Ve: Menstrual blood – Bacterial peroxidase – Urine container contaminated with hypochlorite. False –Ve: Ascorbic acid – Nitrites – Protein – high SG.
SLIDE 17 Urine Dipstick
Results and Interpretations 4- Bilirubin. Interpretation: read at: 30 sec Corresponding to the level of the Bilirubin it could be:
- Ve (in which there is no trace) or
+Ve marked Few 1+ - Medium 2+ - Large 3+. Causes: Hepatitis – Obstructive Jaundice – Hemolytic Anemia…etc. Alteration in Results: False +Ve: Some medications. False –Ve: Ascorbic acid and Sunlight (bilirubin is light sensitive).
SLIDE 18
Urine Dipstick
Results and Interpretations 5- Urobilinogen. Interpretation: Read at: 60 sec 2 strip blocks (3.2 and 16 micor mol/L) indicate normal levels of urobilinogen in urine since a small amount is normally present there. The other 3 blocks (33, 66 and 131 micor mol/L) indicate abnormality and the intensity of this abnormality. Causes: Abnormal readings could be due to: Concentrated urine, hepatitis, hemolysis and intestinal obstruction. Alteration in Results: False +Ve: Sulfonamides medications and high pH in urine. False –Ve: Improperly stored urine will lead to oxidation and conversion from urobiliongen to urobilin.
SLIDE 19
Urine Dipstick
Results and Interpretations 6- a - Protein. Interpretation: Read at: 60 sec The pad for protein is mostly sensitive to Albumin more than other proteins that could be present in urine (e.g. Gamma Globulin, glycolproteins, Bence-Johns protein…etc). The test could be –Ve for protein, or a five ranges of concentration could ne present: Trace +1 (0.3 g/L). +2 (1 g/L). +3 (3 g/L). +4 (>20 g/L). It is important to note SG as well, because a trace in diluted urine could be significant.
SLIDE 20
Urine Dipstick
Results and Interpretations 6- b - Protein. Causes: Along with other causes, glomerulonephritis, tubular diseases and Urinary Tract Infection (UTI) are of the most important to note. Alteration of Results: False +Ve: Fever, Exercise and concentrated urine. Also contamination with vaginal fluids, semen, pus, blood and bacteria. False –Ve: Diluted urine.
SLIDE 21 Urine Dipstick
Results and Interpretations 7- a - Glucose. Interpretation: Read at: 60 sec Although a small amount of glucose can be present in urine (2-20 mg per 100 mL
- f urine), glycosuria happens when the glucose exceeds the renal threshold of 160-
180 mg/dL. The dipstick values range from –Ve for Glucose to: Trace (5 mmol/L) 1+ (14 mmol/L) 2+ (28 mmol/L) 3+ (55 mmol/L) 4+ (110 mmol/L) Comapring with Ketones and SG is important. The positivity reflects the amount of glucose in the blood.
SLIDE 22 Urine Dipstick
Results and Interpretations 7- b - Glucose. Causes: Diabetes mellitus and renal glycosuria...etc. Alteration of results: False +Ve: Only if left exceeding the given reading time or exposure to an
- xidizing agent, there is no other urine content can interfere with the reaction.
False –Ve: Diluted urine (SG) and Ascorbic Acid (blocks the reaction).
SLIDE 23
Urine Dipstick
Results and Interpretations 8- Ketones. Interpretation: Read at: 40 sec The color chart ranges from –Ve light pink to large dark maroon, 6 indicators represent Ketones concentration in mmol/L. Causes: Diabetes mellitus and starvation are the most important to be considered. Alteration of Results: False +Ve: Concentrated urine, high pH, some medications and highly pigmented urine.
SLIDE 24
Urine Dipstick
Results and Interpretations 9- a - Leukocyte Esterase. Interpretation: Read at: 2 minutes. The test detects cell number n micro liter of urine, it could be –Ve or: Trace (15 cell/microL) Few (70 cell/microL) Medium (125 cell/microL) Large (500 cell/microL) Nitrite and protein are important factors to observe along.
SLIDE 25
Urine Dipstick
Results and Interpretations Causes: UTI and fever. Alteration of Results: False +Ve: Oxidizing agents, contamination with vaginal discharge, drugs containing Calvulanic acid and infection with Trichomonas. False –Ve: High SG, high protein, high glucose (the combination of these 3 in urine may block the release of Estrase from Neutrophils). Also, Ascorbic acid and some drugs like Tetracyclins may cause false –Ve result. 9- b - Leukocyte Esterase.
SLIDE 26
Interpretation: read at: 60 sec It is best to obtain urine that was at least incubated for 4 hours in the bladder. The test could be –Ve for bacteruria or may be +Ve with a uniformly pink color, the positivity of the test reflects the presence of >10,000 organism/milliliter of urine. Causes: UTI with/without fever. Alteration of Result: False +Ve: Long standing test allow organisms to grow on the strip and produce nitrite. Also, red pigmented urine. False –Ve: 1-High level of Ascorbic acid. 2-Inection with an organism that does not produce nitrite. 3-Urine sample that was not incubated for enough time.
Urine Dipstick
Results and Interpretations 10- Nitrite.
SLIDE 27
Urine Dipstick
Thank you