
SLIDE 1
7/24/2010 1
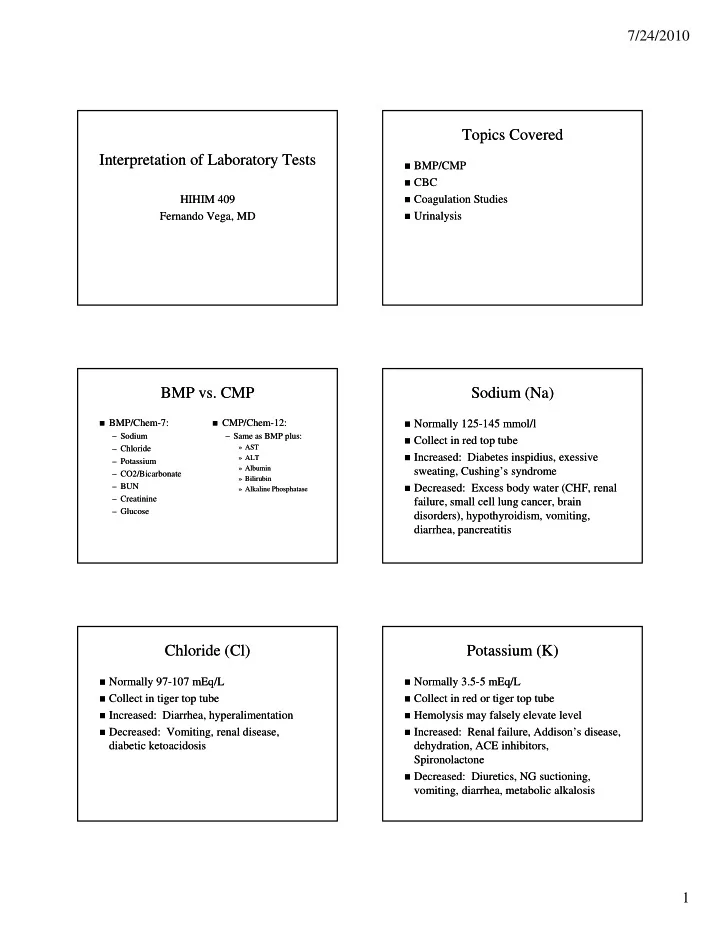
Interpretation of Laboratory Tests Interpretation of Laboratory Tests
HIHIM 409 HIHIM 409 Fernando Vega, MD Fernando Vega, MD
Topics Covered Topics Covered
BMP/CMP
BMP/CMP
CBC
CBC
Coagulation Studies
Coagulation Studies
Urinalysis
Urinalysis
BMP vs. CMP BMP vs. CMP
BMP/Chem
BMP/Chem-
- 7:
7:
– Sodium Sodium – Chloride Chloride – Potassium Potassium
CMP/Chem
CMP/Chem-
- 12:
12:
– Same as BMP plus: Same as BMP plus:
» AST AST » ALT ALT Alb i Alb i
– CO2/Bicarbonate CO2/Bicarbonate – BUN BUN – Creatinine Creatinine – Glucose Glucose
» » Albumin Albumin » Bilirubin Bilirubin » Alkaline Phosphatase Alkaline Phosphatase
Sodium (Na) Sodium (Na)
Normally 125
Normally 125-
- 145 mmol/l
145 mmol/l
Collect in red top tube
Collect in red top tube
Increased: Diabetes inspidius, exessive
Increased: Diabetes inspidius, exessive sweating, Cushing’s syndrome sweating, Cushing’s syndrome
Decreased: Excess body water (CHF, renal
Decreased: Excess body water (CHF, renal failure, small cell lung cancer, brain failure, small cell lung cancer, brain disorders), hypothyroidism, vomiting, disorders), hypothyroidism, vomiting, diarrhea, pancreatitis diarrhea, pancreatitis
Chloride (Cl) Chloride (Cl)
Normally 97
Normally 97-
- 107 mEq/L
107 mEq/L
Collect in tiger top tube
Collect in tiger top tube
Increased: Diarrhea, hyperalimentation
Increased: Diarrhea, hyperalimentation
Decreased: Vomiting, renal disease,
Decreased: Vomiting, renal disease, diabetic ketoacidosis diabetic ketoacidosis
Potassium (K) Potassium (K)
Normally 3.5
Normally 3.5-
- 5 mEq/L