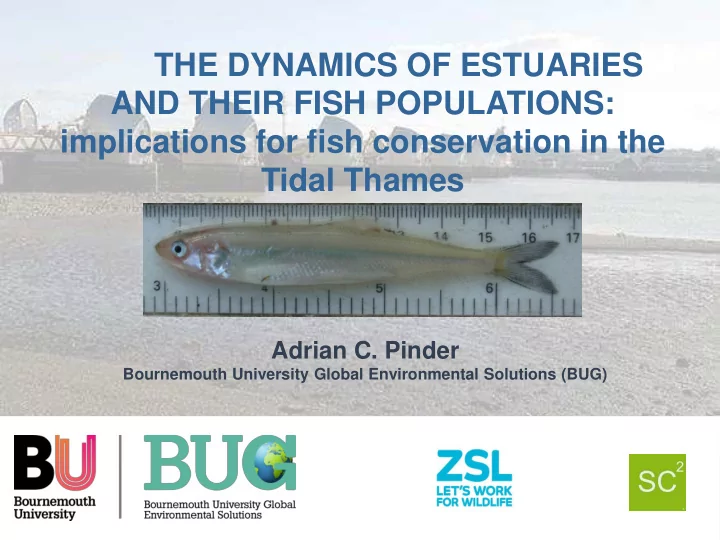
SLIDE 1 THE DYNAMICS OF ESTUARIES AND THEIR FISH POPULATIONS: implications for fish conservation in the Tidal Thames
Adrian C. Pinder
Bournemouth University Global Environmental Solutions (BUG)
SLIDE 2
ESTUARIES AND THEIR VALUE: wildlife
SLIDE 3
ESTUARIES AND THEIR VALUE: leisure
SLIDE 4
ESTUARIES AND THEIR VALUE: commercial fisheries
SLIDE 5
ESTUARIES AND THEIR VALUE: development & transport
SLIDE 6
ESTUARIES AND THEIR VALUE: power generation
SLIDE 7 Threats to fish populations
- Noise
- Entrainment / impingement
- Pollution (industrial, domestic,
agriculture)
SLIDE 8 WHY DO FISH USE ESTUARIES?: Diadromy
Elliott et al. (2007). The guild approach to categorizing estuarine fish assemblages: a global review. Fish and Fisheries, 8(3), 241-268.
SLIDE 9
- Globally recognised as important
nursery zones
- Freshwater and marine species
- Rich feeding opportunities / Predator
avoidance prospects
WHY DO FISH USE ESTUARIES?: Nursery function
SLIDE 10
THE CONCEPT OF ONTOGENETIC ECOLOGY
SLIDE 11 MORPHOLOGICAL AND PHYSICAL CHANGE IN FISHES
- Fish transition through a
number of well defined
- ntogenetic stages
- Thresholds between
stages often translate to sudden shifts in behaviour and ecology
SLIDE 12
shingle mud flats boulders sand bar CHANGING HABITAT AND ITS VALUE TO 0+ FISHES
SLIDE 13 Factors influencing estuarine utilisation of 0+ fishes
Freshwater Estuary Marine Flow rate Salinity & turbidity Tidal cycle Production of freshwater & anadromous fauna Production of Marine & catadromous fauna Seasonal bio-rythms
Abiotic Biotic Temporal
Seasonal bio-rythms Production of estuarine & anadromous fauna Seasonal bio-rythms
Highly mobile and temporally dynamic fish communities
SLIDE 14 Current research on the Tidal Thames
0+ FISH IN THE THAMES Investigating the ecological function of the Tidal Thames and the impact of improved water quality on fish populations
Tidal Thames Biological Timeline
1800 1850 1950 1900 2000
125 species since 1964; nursery for 21 species
SLIDE 15 PROJECT OBJECTIVES
- Characterise temporal variability in fish species community
structure and abundance
- Construct pre-Tideway improvement ecological baseline
- 3D utilisation of space and tides?
SLIDE 16 GLASS EEL MIGRATION MODEL
Harrison, A. J. et al. (2014). A review of glass eel migratory behaviour, sampling techniques and abundance estimates in estuaries: implications for assessing recruitment, local production and exploitation. Reviews in fish biology and fisheries, 24(4), 967-983.
quantify recruitment and exploitation of glass eels ascending the Bristol Channel rivers
SLIDE 17 PROJECT OBJECTIVES
- Characterise temporal variability in fish species community
structure and abundance
- Construct pre-Tideway improvement ecological baseline
- 3D utilisation of space and tides?
- Communicate the importance of the tidal Thames to the
general public through citizen science involvement
SLIDE 18 Current monitoring – Temporal and spatial survey effort
- Two year programme (2017-2018)
- Fortnightly (March – November)
Putney Greenwich Blackfriars
SLIDE 19 Current monitoring – survey methods
- Bespoke multi-method approach
- Seine netting (3mm mesh) at low tide (general fish
community structure at each site)
SLIDE 20 Current monitoring – survey methods
- Marginal push nets (1.5mm mesh) used two
hours either side of low tide (importance of extreme margins for refuge and STST)
SLIDE 21 Mid-channel ichthyoplankton trawls during flood and first hour of ebb tides (to determine utilisation of main channel for eggs/larval transport (STST)
Current monitoring – survey methods
surface 2m
SLIDE 22 Current monitoring – initial observations
Freshwater Diadromous Marine Roach Rutilus rutilus European eel Anguilla anguilla Sea bass Dicentrarchus labrax Dace Leuciscus leuciscus Smelt Osmerus eperlanus Thinlip mullet Chelon ramada Perch Perca fluviatilis Sand smelt Atherina presbyter Bullhead Cottus gobio Common goby Pomatoschistus microps 3-sp’ stickleback Gasterosterus aculeatus Sand goby Pomatoschistus minutus 9-sp’ stickleback Pungitius pungitius Flounder Platichthys flesus Common bream Abramis brama Snake pipefish Entelurus aequoreus Ruffe Gymnocephalus cernua Zander Sander lucioperca Chub Squalius cephalus Bleak Alburnus alburnus
20 species so far….
SLIDE 23
Current monitoring – ontogenetic shifts
Flounder Platichthys flesus
SLIDE 24
MANAGEMENT IMPLICATIONS Evidence based management strategy Theoretical approach
SLIDE 25
Thank you – any questions?