
Enabling low cost tidal energy. Andrew Scott Chief Executive Officer Scotrenewables Tidal Power Limited
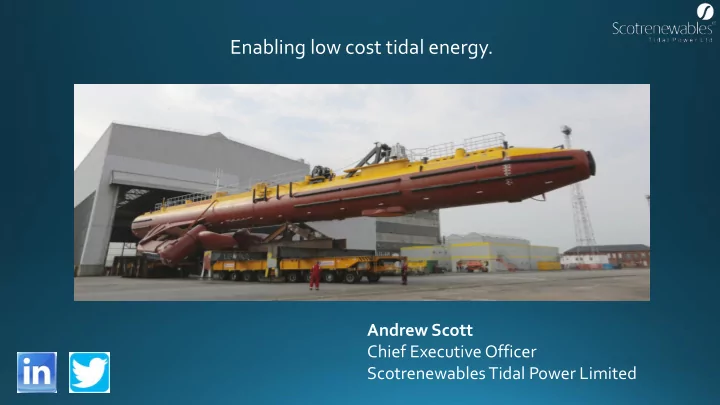
World’s largest tidal turbine – 2MW. Launched May 2016. 2 x 1MW nacelles with 16m rotor diameters. Stall regulated control. 500T turbine mass.
De- risk project economics by removing dependency on high spec, high cost, low availability specialist vessels. Complete precision turbine construction, assembly and commissioning in controlled environment. Remove offshore heavy lifts and high tolerance interfaces in offshore construction work and offshore operations.
Modular fabrication based around low cost steel structure using standard manufacturing equipment and infrastructure. Use of available products engaged OEM’s in critical drive train components. All site construction work and installation for SR1-2000 completed by multi-cat vessels. SR1-2000 capable of quick installation and recovery from site (in under 30 minutes) using multi- cat vessels.
Maximise generator uptime by enabling rapid maintenance interventions informed by comprehensive condition monitoring and carried out by locally based service team. Reduce OPEX with use of low cost, high availability, locally stationed vessels. Maximise turbine accessibility via marine operations and turbine design.
Majority of turbine equipment and auxiliary systems located in hull. Hull accessible quickly via RIB at low costs (crew transit time <1hr @ EMEC). Hull accessibility demonstrated in up to 2m significant wave height therefore accessible 90%+ of the year (@ EMEC).
Vast database for MTBF of all major components in analogous applications. Demonstrated consequential costs and losses from components and systems responsible for most frequent outages and (cumulatively) longest outages. SR1-2000 DEMONSTRATED MAINTENANCE CASE STUDIES Inverter module failure. Electrical drive and control faults. Dynamic cable re-splice. Turbine shut down. Most commonly occurring generic Non-standard cable repair requiring fault category resulting in most turbine shut down. Swapped out via RIB access downtime for offshore wind within 24hrs of intervention turbines. Single multi-cat vessel intervention to decision whilst turbine cut and re-splice subsea cable joint. remained on site. Demonstrated time to reset/resolve for SR1-2000: less than 12hrs turbine Completed in less than 48hrs from Turbine re-commissioned downtime using RIB style vessels. vessel mobilisation in up to 1.5m Hs and generating within 36hr. sea conditions. Total costs under £50k.
Thrust and mooring loads in close correlation to simulations = good numerical characterisation of system at large scale. Ultimate mooring loads driven by controllable generation thrust (i.e. highly survivable in storm conditions). Dynamic loading variation due to surface waves manageable for generation across ~97% of annual occurrence (@ EMEC). Measured vs Predicted Dynamic Mooring Load with turbine operating at 1MW in waves of Hs = 1.2, Tp = 8s opposing of tide of 2.3m/s
Increase generator yield by positioning rotors in fastest flow regions near the surface.
Extensive academic and industrial understanding of rotor performance. Developed industry computational models for validating yield performance. Existing sensors capable of accurately characterising and monitoring resource.
2.2MW peak output.
2.2MW peak output. 20MWh+ in 24hrs generation = 41% capacity factor.
2.2MW peak output. 20MWh+ in 24hrs generation = 41% capacity factor. 125MWh in 7 days of continuous generation = 37% capacity factor.
2.2MW peak output. 20MWh+ in 24hrs generation = 41% capacity factor. 125MWh in 7 days of continuous generation = 37% capacity factor. Provided 7%+ of entire Orkney electricity demand over 1 week of continuous generation.
2.2MW peak output. 20MWh+ in 24hrs generation = 41% capacity factor. 125MWh in 7 days of continuous generation = 37% capacity factor. Provided 7%+ of entire Orkney electricity demand over 1 week of continuous generation. Predictable source of generation.
2.2MW peak output. 20MWh+ in 24hrs generation = 41% capacity factor. 125MWh in 7 days of continuous generation = 37% capacity factor. Provided 7%+ of entire Orkney electricity demand over 1 week of continuous generation. Predictable source of generation. 0.75GWh+ and ongoing.
www.scotrenewables.com
Recommend
More recommend