SLIDE 1 Summary of Consolidated Business Results of Tokio Marine Holdings, Inc. under Japanese GAAP for the nine months ended December 31, 2016
February 14, 2017 Company Name: Tokio Marine Holdings, Inc. (the "Company") Stock Exchange Listing: Tokyo Securities Code Number: 8766 (URL: http://www.tokiomarinehd.com/en/) Representative: Tsuyoshi Nagano, President Contact: Hiroaki Shirota, Corporate Planning Dept. (Tel: 03-5223-3212) Scheduled date for filing the quarterly securities report for the nine months ended December 31, 2016: February 14, 2017 Scheduled date for starting payment of dividends: Not applicable Supplementary information for quarterly financial statements: Available Quarterly IR Conference Call: To be held (for analysts) (Note) All amounts are truncated and all percentages are rounded.
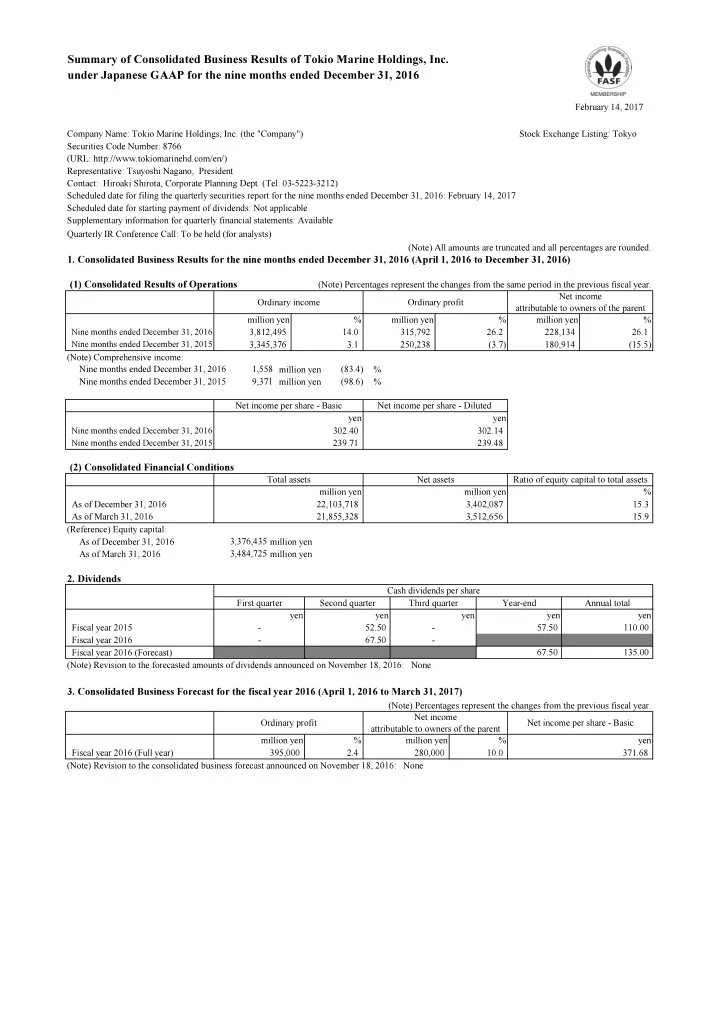
- 1. Consolidated Business Results for the nine months ended December 31, 2016 (April 1, 2016 to December 31, 2016)
(Note) Percentages represent the changes from the same period in the previous fiscal year. (Note) Comprehensive income: Nine months ended December 31, 2016 million yen % Nine months ended December 31, 2015 million yen % (Reference) Equity capital: As of December 31, 2016 million yen As of March 31, 2016 million yen
(Note) Revision to the forecasted amounts of dividends announced on November 18, 2016: None
- 3. Consolidated Business Forecast for the fiscal year 2016 (April 1, 2016 to March 31, 2017)
(Note) Percentages represent the changes from the previous fiscal year. (Note) Revision to the consolidated business forecast announced on November 18, 2016: None yen 371.68 2.4 % million yen 280,000 % 10.0
(1) Consolidated Results of Operations
Net income attributable to owners of the parent Net income per share - Basic
(2) Consolidated Financial Conditions
First quarter Fiscal year 2015 57.50
228,134 million yen 180,914 (15.5) % Net income attributable to owners of the parent 110.00 yen Annual total 26.1 3,512,656 15.9 Ratio of equity capital to total assets million yen % 135.00
67.50 Ordinary profit Third quarter yen Fiscal year 2016 Fiscal year 2016 (Forecast) 15.3 3,402,087 22,103,718 Total assets million yen (83.4) (98.6) 1,558 9,371 395,000 Fiscal year 2016 (Full year) Cash dividends per share Second quarter Ordinary profit million yen million yen 302.14 Ordinary income Net income per share - Basic Net income per share - Diluted % % Nine months ended December 31, 2016 Nine months ended December 31, 2015 Nine months ended December 31, 2016 302.40 3,345,376 3.1 250,238 yen As of March 31, 2016 21,855,328 As of December 31, 2016 (3.7) 26.2 14.0
yen yen yen Nine months ended December 31, 2015 yen million yen 315,792 239.71 239.48 Net assets 3,812,495 3,376,435 3,484,725
SLIDE 2 *Notes
(1) Significant changes with respect to the subsidiaries of the Company (changes in Specified Subsidiaries that resulted in changes in the scope of consolidation) during the nine months ended December 31, 2016: None (2) Adoption of special accounting methods that can be applied to quarterly consolidated financial reports: None (3) Changes in accounting policies, changes in accounting estimates, and retrospective restatements (a) Changes in accounting policies to reflect amendments of accounting standards and related matters: None (b) Changes in accounting policies other than (a): Yes (c) Changes in accounting estimates: Yes (d) Retrospective restatements: None (Note) Please refer to Appendix p. 3 "(1) Changes in accounting policies, changes in accounting estimates, and retrospective restatements" for details. (4) Number of shares issued (common share) (a) Total number of shares issued (including treasury shares) As of December 31, 2016 shares As of March 31, 2016 shares (b) Number of treasury shares held As of December 31, 2016 shares As of March 31, 2016 shares (c) Average number of shares outstanding During the nine months ended December 31, 2016 shares During the nine months ended December 31, 2015 shares
*Disclosure regarding the execution of the quarterly review process
This Summary of Consolidated Business Results is outside the scope of the external auditor's quarterly review procedure required by the Financial Instruments and Exchange Act. The quarterly review process has been completed as of the date of the disclosure of the Summary
- f Consolidated Business Results.
*Notes concerning the business forecast and other items
Any business forecasts contained in this document are based on the information available to the Company as of the date of the release of this document and certain assumptions, and actual results may materially differ from the forecasts due to various factors. 757,524,375 754,694,319 754,406,947 7,407,456 2,839,782 757,524,375
SLIDE 3 Contents of Appendix
- 1. Qualitative information concerning the Consolidated Business Results for the nine months
ended December 31, 2016 ·············································································2 (1) Qualitative information concerning the consolidated results of operations ···················2 (2) Qualitative information concerning the consolidated financial conditions ····················2 (3) Qualitative information concerning the consolidated business forecast ·······················2
- 2. Information concerning Summary (Notes) ·························································3
(1) Changes in accounting policies, changes in accounting estimates, and retrospective restatements ·······························································································3 (2) Additional information ···············································································3
- 3. Consolidated Financial Statements ··································································4
(1) Consolidated Balance Sheet ·········································································4 (2) Consolidated Statement of Income and Consolidated Statement of Comprehensive Income·5 (3) Notes regarding going concern assumption ·······················································7 (4) Notes regarding significant changes in shareholders' equity ····································7
- 4. Supplementary information ···········································································8
(1) Summary of Consolidated Business Results ······················································8 (2) Premiums written and claims paid by lines of business ··········································9 (3) Securities ···························································································· 10 (4) Derivative financial instruments ·································································· 11 (5) Financial results of major consolidated subsidiaries ··········································· 12
- Tokio Marine & Nichido Fire Insurance Co., Ltd. (non-consolidated) ···················· 12
- Nisshin Fire & Marine Insurance Co., Ltd. (non-consolidated) ···························· 16
- E.design Insurance Co., Ltd. (non-consolidated) ············································· 20
- Tokio Marine & Nichido Life Insurance Co., Ltd. (non-consolidated) ···················· 22
Glossary of terminology ·········································································· 27
Tokio Marine Holdings, Inc. 1
SLIDE 4
- 1. Qualitative information concerning the Consolidated Business Results for the nine
months ended December 31, 2016 (1) Qualitative information concerning the consolidated results of operations During the nine months ended December 31, 2016, after the election of U.S. President Trump, expectations for his expansionary fiscal policy resulted in improved business confidence and the world economy, Europe and the U.S. in particular, continued to recover gradually. In Japan, despite weakness in consumer spending, the economy continued to grow slowly due to recovery of production and exports. Under these conditions, as a result of our efforts to expand our business, which is centered on property and casualty and life insurance, our consolidated results of operations for the nine months ended December 31, 2016 were as follows: Ordinary income increased by 467.1 billion yen to 3,812.4 billion yen from the same period in the previous fiscal year, the main components of which were underwriting income of 3,309.2 billion yen and investment income of 420.3 billion yen. Ordinary expenses increased by 401.5 billion yen to 3,496.7 billion yen from the same period in the previous fiscal year, the main components of which were underwriting expenses of 2,823.0 billion yen, investment expenses
- f 58.6 billion yen, and operating and general administrative expenses of 602.1 billion yen.
As a result, ordinary profit increased by 65.5 billion yen to 315.7 billion yen from the same period in the previous fiscal year. Net income attributable to owners of the parent, composed of ordinary profit plus extraordinary gains minus extraordinary losses and total income taxes, increased by 47.2 billion yen to 228.1 billion yen from the same period in the previous fiscal year. (2) Qualitative information concerning the consolidated financial conditions As of December 31, 2016, consolidated total assets increased by 248.3 billion yen to 22,103.7 billion yen from that as of March 31, 2016. In spite of the decrease in value of assets of
- verseas consolidated companies caused by the appreciation of the yen, total assets increased
due to accumulation of investment assets led by increased securities lending transactions, as well as the expansion of our domestic and international insurance businesses. (3) Qualitative information concerning the consolidated business forecast The consolidated business forecast announced on November 18, 2016 remains unchanged.
Tokio Marine Holdings, Inc. 2
SLIDE 5
- 2. Information concerning Summary (Notes)
(1) Changes in accounting policies, changes in accounting estimates, and retrospective restatements (Changes in accounting policies which are difficult to distinguish from changes in accounting estimates) The Company and its domestic consolidated subsidiaries have changed the depreciation method for tangible fixed assets from the declining balance method to the straight-line method since the beginning of the fiscal year 2016. Previously, the Company and its domestic consolidated subsidiaries applied the declining balance method for depreciation of tangible fixed assets except for buildings (excluding fixtures attached to buildings) acquired on or after April 1, 1998, to which the straight-line method was applied. The proportion of companies adopting the straight-line method has increased due to the recent expansion in our overseas insurance business. For this reason, the Company and its domestic consolidated subsidiaries reviewed its depreciation methods and determined that allocating depreciation expenses equally over useful lives will represent the actual situation more accurately since it is expected that tangible fixed assets owned by the Company and its domestic consolidated subsidiaries will be used stably over their useful lives. Herewith, the accounting policy of depreciation method for tangible fixed assets applied by the Company and its domestic consolidated subsidiaries is unified to that applied by its overseas consolidated subsidiaries. As a result of this change, both ordinary profit and income before income taxes and non-controlling interests for the nine months ended December 31, 2016 increased by 2,198 million yen, compared with the previous accounting method. (2) Additional information (Application of the "Implementation Guidance on Recoverability of Deferred Tax Assets") The Company and its domestic consolidated subsidiaries have applied the "Implementation Guidance on Recoverability of Deferred Tax Assets" (Accounting Standards Board of Japan, Guidance No. 26, March 28, 2016), since the beginning of the fiscal year 2016.
Tokio Marine Holdings, Inc. 3
SLIDE 6
- 3. Consolidated Financial Statements
(1) Consolidated Balance Sheet
(Yen in millions) Assets
1,031,610 782,689 21,000
- Receivables under resale agreements
4,999 24,999
Receivables under securities borrowing transactions
21,597 21,261 1,345,859 1,225,283 63,049 84,316 15,457,012 15,990,343 878,951 1,181,294 277,413 278,259 1,022,112 814,064 1,692,808 1,668,896 12,440 13,850 33,558 27,096
Customers' liabilities under acceptances and guarantees
9,026 2,465 (16,111) (11,105) 21,855,328 22,103,718
Liabilities
15,144,114 15,008,612 2,663,123 2,520,448 12,480,991 12,488,164 77,677 63,303 2,291,591 2,809,030 242,952 246,792 21 23 57,355 38,163 88,144 92,584 88,144 92,584 361,960 378,498 69,827 62,156 9,026 2,465 18,342,671 18,701,630
Net assets Shareholders' equity Share capital
150,000 150,000
Retained earnings
1,531,072 1,672,036
Treasury shares
(10,742) (34,738) 1,670,329 1,787,297 1,601,187 1,746,843 19,870 12,938 210,134 (158,082) (16,796) (12,561) 1,814,395 1,589,138 2,485 2,140 25,445 23,511 3,512,656 3,402,087 21,855,328 22,103,718
Total liabilities Accumulated other comprehensive income Insurance liabilities Total shareholders' equity Price fluctuation reserve Underwriting reserves Outstanding claims As of December 31, 2016 As of March 31, 2016 Negative goodwill Acceptances and guarantees Intangible fixed assets Corporate bonds Other liabilities Net defined benefit liabilities Net defined benefit assets Deferred tax assets Allowance for doubtful accounts Total assets Money trusts Securities Loans Tangible fixed assets Share acquisition rights Non-controlling interests Total net assets Total liabilities and net assets Total accumulated other comprehensive income Unrealized gains (losses) on available-for-sale securities Deferred gains (losses) on hedge transactions Foreign currency translation adjustments Remeasurements of defined benefit plans Cash and bank deposits Call loans Provision for retirement benefits for directors Provision for employees' bonus Reserves under special laws Deferred tax liabilities Other assets Monetary receivables bought
Tokio Marine Holdings, Inc. 4
SLIDE 7 (2) Consolidated Statement of Income and Consolidated Statement of Comprehensive Income
(Consolidated Statement of Income)
(Yen in millions) Nine months ended December 31, 2015 Nine months ended December 31, 2016 (April 1, 2015 to December 31, 2015) (April 1, 2016 to December 31, 2016)
3,345,376 3,812,495 2,893,649 3,309,235 2,498,279 2,538,961 97,840 91,802 37,931 37,482 255,350 633,129 377,362 420,385 294,979 299,542 22 119 890 19,466 98,031 99,029 443 517 9,077
23,910 (37,931) (37,482) 74,364 82,874
Amortization of negative goodwill
7,671 7,671 679
3,496,702 2,534,913 2,823,053 1,243,204 1,296,379 94,352 98,793 496,013 486,044 159,429 143,131 123 68 287,187 444,129 144,646 132,099 102,335 218,776 33,581 58,648 8 3,236 10,462 18,431 8,168 4,852 834 2,121
516,046 602,150 10,596 12,850 5,126 8,138 64 176
Equity in losses of affiliates
2,870 2,870 250,238 315,792
Ordinary income Underwriting income Net premiums written Deposit premiums from policyholders Investment income on deposit premiums Life insurance premiums Investment income Interest and dividends Gains on money trusts Gains on trading securities Gains on sales of securities Gains on redemption of securities Gains on derivatives Investment gains on separate accounts Transfer of investment income on deposit premiums Other ordinary income Equity in earnings of affiliates Ordinary expenses Underwriting expenses Net claims paid Loss adjustment expenses Agency commissions and brokerage Maturity refunds to policyholders Dividends to policyholders Life insurance claims Provision for outstanding claims Provision for underwriting reserves Investment expenses Losses on money trusts Losses on sales of securities Impairment losses on securities Losses on redemption of securities Losses on derivatives Operating and general administrative expenses Other ordinary expenses Interest expenses Losses on bad debts Amortization of deferred assets under Article 113 of the Insurance Business Act Ordinary profit
Tokio Marine Holdings, Inc. 5
SLIDE 8
(Yen in millions) Nine months ended December 31, 2015 Nine months ended December 31, 2016 (April 1, 2015 to December 31, 2015) (April 1, 2016 to December 31, 2016)
205 8,073 129 5,628 76 2,445 6,240 6,872 580 1,351 1,380 803 4,227 4,439
Provision for price fluctuation reserve
4,227 4,439 52 278 244,203 316,993 71,461 93,225 (9,099) (5,306) 62,362 87,918 181,841 229,075 926 940 180,914 228,134
Extraordinary gains Gains on disposal of fixed assets Other extraordinary gains Extraordinary losses Losses on disposal of fixed assets Impairment losses on fixed assets Provision for reserves under special laws Net income attributable to owners of the parent Income taxes - deferred Total income taxes Net income Net income attributable to non-controlling interests Other extraordinary losses Income before income taxes and non-controlling interests Income taxes - current
Tokio Marine Holdings, Inc. 6
SLIDE 9
(Consolidated Statement of Comprehensive Income)
(Yen in millions) Nine months ended December 31, 2015 Nine months ended December 31, 2016 (April 1, 2015 to (April 1, 2016 to December 31, 2015) December 31, 2016)
181,841 229,075
Other comprehensive income
(117,404) 146,101 (1,694) (6,932) (56,126) (368,091)
Remeasurements of defined benefit plans
3,711 4,236 (955) (2,830)
Total other comprehensive income
(172,469) (227,516)
Total comprehensive income
9,371 1,558
Comprehensive income attributable to:
11,891 2,767 (2,520) (1,208)
Net income Unrealized gains (losses) on available-for-sale securities Non-controlling interests Deferred gains (losses) on hedge transactions Foreign currency translation adjustments Share of other comprehensive income of affiliates accounted for by the equity method Owners of the parent
(3) Notes regarding going concern assumption
Not applicable.
(4) Notes regarding significant changes in shareholders' equity
Not applicable.
Tokio Marine Holdings, Inc. 7
SLIDE 10
- 4. Supplementary information
(1) Summary of Consolidated Business Results
(Yen in millions) Ordinary income and expenses
% 2,893,649 3,309,235 415,585 14.4
Net premiums written
2,498,279 2,538,961 40,682 1.6 97,840 91,802 (6,037) (6.2)
Life insurance premiums
255,350 633,129 377,779 147.9 2,534,913 2,823,053 288,139 11.4
Net claims paid
1,243,204 1,296,379 53,175 4.3
Loss adjustment expenses
94,352 98,793 4,441 4.7
Agency commissions and brokerage
496,013 486,044 (9,969) (2.0)
Maturity refunds to policyholders
159,429 143,131 (16,297) (10.2)
Life insurance claims
287,187 444,129 156,942 54.6
Provision for outstanding claims
144,646 132,099 (12,546) (8.7)
Provision for underwriting reserves
102,335 218,776 116,441 113.8 377,362 420,385 43,022 11.4
Interest and dividends
294,979 299,542 4,562 1.5
Gains on sales of securities
98,031 99,029 997 1.0
Gains on derivatives
9,077
(100.0)
Investment gains on separate accounts
3,261 23,910 20,648 633.1 33,581 58,648 25,066 74.6
Losses on sales of securities
10,462 18,431 7,968 76.2
Impairment losses on securities
8,168 4,852 (3,316) (40.6)
Losses on derivatives
18,991
602,150 86,103 16.7 63,768 70,023 6,255 9.8
Equity in earnings (losses) of affiliates
679 (249) (928) (136.7) 250,238 315,792 65,554 26.2
Extraordinary gains and losses
205 8,073 7,867 3,821.6 6,240 6,872 632 10.1 (6,034) 1,201 7,235
316,993 72,790 29.8 71,461 93,225 21,763 30.5 (9,099) (5,306) 3,792
87,918 25,556 41.0 181,841 229,075 47,233 26.0 926 940 14 1.6 180,914 228,134 47,219 26.1
Increase (Decrease) Rate of change Nine months ended December 31, 2016 Income taxes - deferred Underwriting income Investment expenses Operating and general administrative expenses Other ordinary income and expenses Underwriting expenses Net income attributable to owners of the parent Ordinary profit Extraordinary losses Extraordinary gains (losses) Net income attributable to non-controlling interests Net income Income taxes - current Total income taxes ( April 1, 2016 to December 31, 2016 ) Investment income Deposit premiums from policyholders Nine months ended December 31, 2015 ( April 1, 2015 to December 31, 2015 ) Income before income taxes and non-controlling interests Extraordinary gains
Tokio Marine Holdings, Inc. 8
SLIDE 11
Direct premiums written including deposit premiums from policyholders (Yen in millions) Amount Amount Fire and allied lines 481,502 18.4 10.7 435,672 15.9 (9.5) Hull and cargo 87,165 3.3 (6.1) 84,218 3.1 (3.4) Personal accident 256,798 9.8 3.5 259,762 9.5 1.2 Voluntary automobile 990,366 37.9 3.5 1,005,339 36.7 1.5 Compulsory automobile liability 218,335 8.4 2.6 219,968 8.0 0.7 Others 579,238 22.2 12.8 734,428 26.8 26.8 Total 2,613,407 100.0 6.3 2,739,389 100.0 4.8 Deposit premiums from policyholders 97,840 3.7 9.5 91,802 3.4 (6.2) Net premiums written (Yen in millions) Amount Amount Fire and allied lines 465,719 18.6 20.5 379,260 14.9 (18.6) Hull and cargo 81,387 3.3 (1.9) 72,043 2.8 (11.5) Personal accident 159,948 6.4 1.0 168,676 6.6 5.5 Voluntary automobile 1,026,288 41.1 4.1 1,044,263 41.1 1.8 Compulsory automobile liability 230,673 9.2 4.2 223,977 8.8 (2.9) Others 534,262 21.4 10.3 650,739 25.6 21.8 Total 2,498,279 100.0 7.7 2,538,961 100.0 1.6 Net claims paid (Yen in millions) Amount Amount Fire and allied lines 205,708 16.5 (5.7) 190,585 14.7 (7.4) Hull and cargo 45,790 3.7 11.6 39,742 3.1 (13.2) Personal accident 73,072 5.9 2.7 72,584 5.6 (0.7) Voluntary automobile 546,085 43.9 2.8 550,771 42.5 0.9 Compulsory automobile liability 174,269 14.0 (0.8) 172,469 13.3 (1.0) Others 198,277 15.9 14.7 270,226 20.8 36.3 Total 1,243,204 100.0 2.7 1,296,379 100.0 4.3 %_ %_ %_ %_ %_ %_ %_ %_ %_ %_
(2) Premiums written and claims paid by lines of business
Nine months ended December 31, 2015 (April 1, 2015 to December 31, 2015) Nine months ended December 31, 2016 (April 1, 2016 to December 31, 2016) Composition ratio Rate of change Composition ratio Rate of change Nine months ended December 31, 2015 (April 1, 2015 to December 31, 2015) Nine months ended December 31, 2016 (April 1, 2016 to December 31, 2016) Composition ratio Rate of change Composition ratio Rate of change Nine months ended December 31, 2015 (April 1, 2015 to December 31, 2015) Nine months ended December 31, 2016 (April 1, 2016 to December 31, 2016) Composition ratio Rate of change Composition ratio Rate of change
%_ %_ Tokio Marine Holdings, Inc. 9
SLIDE 12 (3) Securities
- 1. Bonds held to maturity
(Yen in millions) Fair value Difference Fair value Difference
3,511,474 4,451,153 939,678 4,451,309 5,172,755 721,446 27,016 26,800 (215) 35,193 33,838 (1,355) 3,538,490 4,477,954 939,463 4,486,502 5,206,594 720,091
- 2. Bonds earmarked for underwriting reserves
(Yen in millions) Fair value Difference Fair value Difference
50,128 52,996 2,868 44,150 46,227 2,076 26,948 28,318 1,370 22,764 23,291 526 77,076 81,315 4,239 66,915 69,518 2,603
- 3. Available-for-sale securities
(Yen in millions)
3,536,463 4,055,081 518,618 3,522,575 3,950,354 427,779 685,238 2,270,759 1,585,521 657,210 2,487,899 1,830,688 3,951,169 4,060,303 109,133 3,766,846 3,939,723 172,877 1,428,991 1,429,840 848 1,265,397 1,285,836 20,439 9,601,863 11,815,984 2,214,121 9,212,030 11,663,814 2,451,783
1. 2. 3. (Note) Domestic equity securities Foreign securities Others Total Available-for-sale securities whose fair value cannot be measured reliably are not included in the table above. For the fiscal year 2015, impairment losses of 19,238 million yen (Domestic equity securities 1,136 million yen, Foreign securities 14,960 million yen, Others 3,141 million yen) were recognized for Available-for-sale securities with fair value. For the nine months ended December 31, 2016, impairment losses of 5,890 million yen (Domestic equity securities 38 million yen, Foreign securities 3,826 million yen, Others 2,025 million yen) were recognized for Available-for-sale securities with fair value. In principle, impairment loss on a security with fair value is recognized when the fair value is below its cost by 30% or more. Fair value shown on balance sheet Difference Domestic debt securities Cost Fair value shown on balance sheet Difference As of December 31, 2016 As of March 31, 2016, "Others" includes negotiable certificates of deposit (cost 64,319 million yen, fair value 64,321 million yen, difference 2 million yen) which are presented as Cash and bank deposits on the consolidated balance sheet, and foreign mortgage securities, etc. (cost 1,344,281 million yen, fair value 1,343,216 million yen, difference (1,064) million yen) which are presented as Monetary receivables bought on the consolidated balance sheet. As of December 31, 2016, "Others" includes negotiable certificates of deposit (cost 53,493 million yen, fair value 53,495 million yen, difference 2 million yen) which are presented as Cash and bank deposits on the consolidated balance sheet, and foreign mortgage securities, etc. (cost 1,197,518 million yen, fair value 1,216,196 million yen, difference 18,678 million yen) which are presented as Monetary receivables bought on the consolidated balance sheet. Foreign securities Carrying amount shown on balance sheet Cost Total As of March 31, 2016 As of March 31, 2016 Carrying amount shown on balance sheet As of December 31, 2016 Domestic debt securities As of March 31, 2016 As of December 31, 2016 Domestic debt securities Carrying amount shown on balance sheet Carrying amount shown on balance sheet Foreign securities Total
Tokio Marine Holdings, Inc. 10
SLIDE 13 (Yen in millions)
Principal amount Fair value Unrealized gains (losses) Principal amount Fair value Unrealized gains (losses)
Foreign currency-related instruments Currency futures Short
11,315 (0) (0) 3,485
488 9 9 390
- Foreign exchange forwards
Short
551,317 913 913 774,326 (45,350) (45,350)
Long
57,266 (256) (256) 91,398 (327) (327)
Currency swaps
103,368 (1,265) (1,265) 37,413
Short
60,583 52,430 [5,406] 6,073 (667) [332] 1,683 (1,351)
Long
36,019 21,700 [2,424] 4,272 1,848 [272] 1,594 1,322
Interest rate-related instruments Interest rate futures Short
71,312
801
- 1,815
- Interest rate options
Short
7,159
[-]
3,079,349 38,495 38,495 2,682,999 3,380 3,380
Equity-related instruments Equity index futures Short
12,654 45 45 13,981 (378) (378)
Long
4,700 83 83 14,502 (80) (80)
Equity index options Short
77,990 102,503 [2,616] 1,527 1,089 [2,664] 3,289 (625)
Long
91,821 103,106 [9,111] 4,566 (4,544) [9,189] 6,559 (2,630)
Bond-related instruments Bond futures Short
167,555 41 41 341,113 (2,038) (2,038)
Long
237 237
Bond over-the-counter options Short
56,920 34,667 [793] 687 106 [116] 66 50
Long
46,740 34,667 [285] 266 (19) [180] 348 167
Credit-related instruments Credit derivatives Sell protection
17,250 (318) (318) 16,872 (177) (177)
Commodity-related instruments Commodity swaps
4,259 (145) (145) 3,012 (143) (143)
Others Index basket options Long
128,476 68,867 [48,542] (2,642) (51,184) [37,533] (2,685) (40,218)
Natural catastrophe derivatives Short
32,882 40,812 [2,490] 1,189 1,301 [4,403] 1,878 2,524
Long
19,623 28,392 [1,055] 512 (543) [3,343] 1,190 (2,153)
Weather derivatives Short
13 13 [1] [1]
Others Long
3,305 223 223 2,089 207 207
Total
54,280 (14,572) (30,742) (87,582)
(Note)
- 2. Transactions to which hedge accounting is applied are not included in the table above.
(4) Derivative financial instruments
As of March 31, 2016 As of December 31, 2016
- 1. For option contracts, option premiums are denoted with [ ].
Tokio Marine Holdings, Inc. 11
SLIDE 14 (5) Financial results of major consolidated subsidiaries
Reference: : : :Tokio Marine & Nichido Fire Insurance Co., Ltd. (non-consolidated)
Balance sheet
(Yen in millions)
359,401 3.89 281,649 2.95 (77,752) 21,000 0.23
4,999 0.05 24,999 0.26 20,000
0.31 29,972 42,127 0.46 24,379 0.26 (17,747) 63,049 0.68 84,316 0.88 21,267 7,309,716 79.09 7,562,661 79.21 252,945 527,229 5.70 685,514 7.18 158,285 196,461 2.13 201,797 2.11 5,335 523 0.01 523 0.01 (0) 707,066 7.65 644,696 6.75 (62,370)
Prepaid pension costs
3,595 0.04 5,627 0.06 2,031 15,087 0.16 5,207 0.05 (9,879) (7,713) (0.08) (3,460) (0.04) 4,252 9,242,545 100.00 9,547,885 100.00 305,339 5,362,641 58.02 5,392,583 56.48 29,941 894,692 909,013 14,320 4,467,948 4,483,569 15,621 20,760 0.22 16,010 0.17 (4,750) 908,502 9.83 881,860 9.24 (26,641) 37,609 21,072 (16,537) 1,451 2,709 1,257 3,325 3,334 9 866,115 854,745 (11,370) 196,882 2.13 204,606 2.14 7,723 18,801 0.20 8,396 0.09 (10,404) 81,060 0.88 84,821 0.89 3,760 81,060 84,821 3,760 121,871 1.32 170,300 1.78 48,429 15,087 0.16 5,207 0.05 (9,879) 6,725,606 72.77 6,763,785 70.84 38,179 101,994 1.10 101,994 1.07
1.34 133,625 1.40 10,104 123,521 123,521
10,104 915,848 9.91 1,055,912 11.06 140,063 81,099 81,099
974,812 140,063 25 25
22,785
235,426
716,575 140,063 1,141,364 12.35 1,291,532 13.53 150,168 1,379,502 14.93 1,512,811 15.84 133,309 (3,927) (0.04) (20,244) (0.21) (16,317) 1,375,574 14.88 1,492,566 15.63 116,991 2,516,939 27.23 2,784,099 29.16 267,160 9,242,545 100.00 9,547,885 100.00 305,339
Total liabilities and net assets Assets Total assets Liabilities Total liabilities Other liabilities Net assets Total net assets Acceptances and guarantees Reserves under special laws Deferred tax liabilities Retained earnings Share capital Capital surplus Price fluctuation reserve Unrealized gains (losses) on available-for-sale securities Insurance liabilities Income taxes payable Outstanding claims Asset retirement obligations Provision for employees' bonus Lease obligations Provision for retirement benefits Underwriting reserves Corporate bonds Other liabilities Customers' liabilities under acceptances and guarantees Allowance for doubtful accounts Call loans Securities Receivables under securities borrowing transactions Monetary receivables bought Money trusts Receivables under resale agreements Cash and bank deposits Amount Composition ratio Amount Composition ratio Other assets Loans Intangible fixed assets Tangible fixed assets Total shareholders' equity Surplus reserve Other retained earnings Special reserves Retained earnings carried forward Reserve for special depreciation Advanced depreciation reserve for fixed assets As of December 31, 2016 As of March 31, 2016 Increase (Decrease) Total valuation and translation adjustments Deferred gains (losses) on hedge transactions
% %
Other capital surplus Additional paid-in capital
Tokio Marine Holdings, Inc. 12
SLIDE 15 Reference: : : :Tokio Marine & Nichido Fire Insurance Co., Ltd. (non-consolidated)
Statement of income
(Yen in millions)
2,061,703 1,893,562 (168,140) 1,737,410 1,708,400 (29,010)
Net premiums written
1,604,680 1,582,064 (22,615)
Deposit premiums from policyholders
96,108 90,273 (5,834)
Investment income on deposit premiums
36,432 35,933 (499) 310,862 173,945 (136,917)
Interest and dividends
253,905 124,211 (129,694)
Gains on money trusts
22 119 96
Gains on sales of securities
76,565 81,210 4,645
Transfer of investment income on deposit premiums
(36,432) (35,933) 499 13,429 11,216 (2,212) 1,770,520 1,648,696 (121,823) 1,537,561 1,407,623 (129,937)
Net claims paid
890,525 881,861 (8,664)
Loss adjustment expenses
76,037 77,088 1,050
Agency commissions and brokerage
284,489 280,345 (4,144)
Maturity refunds to policyholders
151,294 135,890 (15,403)
Provision for outstanding claims
32,304 14,320 (17,983)
Provision for underwriting reserves
100,590 15,621 (84,968) 7,934 13,579 5,645
Losses on money trusts
8 3,236 3,228
Losses on sales of securities
2,054 3,168 1,114
Impairment losses on securities
638 785 147 221,892 223,027 1,135 3,132 4,465 1,333
Interest expenses
1,594 4,144 2,550 291,182 244,865 (46,317) 157 9,253 9,095
Gains on disposal of fixed assets
80 7,756 7,676
Gains on liquidation of subsidiaries and affiliates
76 1,496 1,419 5,411 5,318 (93)
Losses on disposal of fixed assets
479 931 451
Impairment losses on fixed assets
1,272 625 (646) 3,621 3,760 139
Provision for price fluctuation reserve
3,621 3,760 139
Losses on liquidation of subsidiaries and affiliates
285,929 248,800 (37,128) 39,437 51,009 11,571 (9,585) 4,758 14,343 29,851 55,767 25,915 256,077 193,033 (63,043)
(Reference) Underwriting profit (loss)
(4,006) 99,706 103,713 60.2 % 60.6 % 0.4 %
Expense ratio (W/P basis)
30.4 30.5 0.1
Combined ratio (W/P basis)
90.6 91.1 0.5 61.4 57.7 (3.7)
Expense ratio (private sector)
32.1 32.2 0.1 93.5 89.9 (3.6)
Total income taxes Income before income taxes Income taxes - current Impairment losses on investment in subsidiaries and affiliates Increase (Decrease) Nine months ended December 31, 2016 Nine months ended December 31, 2015 ( April 1, 2015 to Other ordinary income Investment expenses Underwriting income Loss ratio (private sector, E/I basis) Combined ratio (private sector) Net income Loss ratio (W/P basis) Investment income Extraordinary gains Underwriting expenses Ordinary expenses Ordinary profit Operating and general administrative expenses Other ordinary expenses Provision for reserves under special laws Income taxes - deferred Extraordinary losses Ordinary income December 31, 2015 ) ( April 1, 2016 to December 31, 2016 )
Tokio Marine Holdings, Inc. 13
SLIDE 16 Reference: : : :Tokio Marine & Nichido Fire Insurance Co., Ltd. (non-consolidated)
Underwriting
Direct premiums written excluding deposit premiums from policyholders (Yen in millions) Fire and allied lines 274,470 15.9 12.8 249,607 14.4 (9.1) Hull and cargo 52,730 3.1 0.4 45,483 2.6 (13.7) Personal accident 140,934 8.2 3.5 140,318 8.1 (0.4) Voluntary automobile 773,676 44.9 4.3 789,169 45.7 2.0 Compulsory automobile liability 202,082 11.7 2.8 204,759 11.9 1.3 Others 280,085 16.2 8.8 298,545 17.3 6.6 Total 1,723,979 100.0 5.9 1,727,885 100.0 0.2 Deposit premiums from policyholders 96,108
90,273
Net premiums written (Yen in millions) Fire and allied lines 228,440 14.2 18.5 198,463 12.5 (13.1) Hull and cargo 49,887 3.1 3.4 43,335 2.7 (13.1) Personal accident 137,009 8.5 3.3 136,120 8.6 (0.6) Voluntary automobile 770,998 48.0 4.4 786,675 49.7 2.0 Compulsory automobile liability 214,806 13.4 4.3 209,043 13.2 (2.7) Others 203,537 12.7 2.9 208,427 13.2 2.4 Total 1,604,680 100.0 5.9 1,582,064 100.0 (1.4) Net claims paid (Yen in millions) Fire and allied lines 123,016 0.9 55.6 110,273 (10.4) 57.7 Hull and cargo 28,202 9.2 60.5 25,161 (10.8) 62.2 Personal accident 61,754 0.9 49.5 59,791 (3.2) 48.7 Voluntary automobile 416,018 1.7 59.5 414,418 (0.4) 58.2 Compulsory automobile liability 162,564 (0.8) 82.5 160,949 (1.0) 84.0 Others 98,969 14.7 51.9 111,266 12.4 56.5 Total 890,525 2.6 60.2 881,861 (1.0) 60.6 (Note) Loss ratio is calculated on W/P basis. % Rate of change ( April 1, 2016 to December 31, 2016 ) Rate of change Amount ( April 1, 2015 to December 31, 2015 ) Nine months ended December 31, 2016 ( April 1, 2016 to December 31, 2016 ) Amount Nine months ended December 31, 2015 ( April 1, 2015 to December 31, 2015 ) Composition ratio Composition ratio Rate of change Loss ratio Amount Loss ratio Amount % Composition ratio Rate of change Composition ratio % % % % % % % Nine months ended December 31, 2016 ( April 1, 2016 to December 31, 2016 ) Nine months ended December 31, 2015 Rate of change ( April 1, 2015 to December 31, 2015 ) Amount Amount Rate of change Nine months ended December 31, 2016 % % % Nine months ended December 31, 2015
Tokio Marine Holdings, Inc. 14
SLIDE 17 Reference: : : :Tokio Marine & Nichido Fire Insurance Co., Ltd. (non-consolidated)
Solvency margin ratio (non-consolidated)
(Yen in millions) (A) Total amount of solvency margin
4,493,086 4,905,975 1,139,177 1,291,532
Price fluctuation reserve
81,060 84,821
Contingency reserve
2,956 4,704
Catastrophe loss reserve
1,051,399 1,074,671
General allowance for doubtful accounts
321 245 1,715,688 1,880,699
Unrealized gains (losses) on land
181,477 193,078
Excess of policyholders' contract deposits
- Subordinated debt, etc.
- Deductions
10,089 10,031
Others
331,094 386,254
(B) Total amount of risks (R1+R2)2+(R3+R4)2+R5+R6
1,204,068 1,198,156
General insurance risk (R1)
169,165 171,651
Third sector insurance risk (R2)
- Assumed interest rate risk
(R3)
24,447 24,072
Asset management risk (R4)
880,811 976,115
Business administration risk (R5)
26,618 26,572
Catastrophe risk (R6)
256,519 156,774
(C) Solvency margin ratio [(A)/{(B)×1/2}]×100
746.3% 818.9%
(Note) As of March 31, 2016 As of December 31, 2016 Shareholders' equity less adjusting items Solvency margin ratio as of December 31, 2016 was calculated by methods which the company regarded as reasonable in conformity with the Insurance Business Act and other related regulations. Catastrophe risk was calculated partially based on simplified methods including but not limited to use of data as of September 30, 2016. Unrealized gains (losses) on available-for-sale securities and deferred gains (losses)
- n hedge transactions (prior to tax effect deductions)
Amounts within "Excess of policyholders' contract deposits" and "Subordinated debt, etc." not calculated into the margin
Tokio Marine Holdings, Inc. 15
SLIDE 18 Reference: : : :Nisshin Fire & Marine Insurance Co., Ltd. (non-consolidated)
Balance sheet
(Yen in millions)
% % 29,586 7.02 36,615 8.78 7,029 324,135 76.87 315,714 75.72 (8,420) 317 0.08 285 0.07 (32) 28,770 6.82 28,642 6.87 (128) 91 0.02 91 0.02
5.92 21,966 5.27 (2,994) 1,543 0.37 1,520 0.36 (22) 12,398 2.94 12,218 2.93 (180) (115) (0.03) (115) (0.03) 421,690 100.00 416,940 100.00 (4,749) 295,636 70.11 295,633 70.91 (3) 47,694 48,755 1,060 247,941 246,877 (1,063) 16,824 3.99 14,711 3.53 (2,113) 1,606 365 (1,241) 3 2 (1) 34 11 (23) 15,179 14,332 (847) 1,982 0.47 2,143 0.51 161 609 0.14
1,374 0.33 1,479 0.35 104 1,374 1,479 104 316,427 75.04 313,967 75.30 (2,459) 20,389 4.84 20,389 4.89
3.68 15,518 3.72
12,620
2,898
7.99 29,330 7.03 (4,377) 7,769 7,769
21,560 (4,377) 8,840 8,840
1,790
10,930 (4,377) 69,616 16.51 65,238 15.65 (4,377) 35,646 8.45 37,734 9.05 2,087 35,646 8.45 37,734 9.05 2,087 105,263 24.96 102,973 24.70 (2,290) 421,690 100.00 416,940 100.00 (4,749)
Amount Amount Composition ratio Tangible fixed assets Increase (Decrease) Cash and bank deposits Loans As of March 31, 2016 As of December 31, 2016 Composition ratio Securities Assets Intangible fixed assets Other assets Total assets Liabilities Deferred tax assets Allowance for doubtful accounts Prepaid pension costs Other liabilities Insurance liabilities Outstanding claims Underwriting reserves Other liabilities Asset retirement obligations Income taxes payable Lease obligations Total net assets Provision for retirement benefits Total shareholders' equity Unrealized gains (losses) on available-for-sale securities Total valuation and translation adjustments Provision for employees' bonus Reserves under special laws Price fluctuation reserve Retained earnings carried forward Retained earnings Surplus reserve Other retained earnings Special reserves Total liabilities Net assets Total liabilities and net assets Advanced depreciation reserve for fixed assets Share capital Capital surplus Additional paid-in capital Other capital surplus
Tokio Marine Holdings, Inc. 16
SLIDE 19 Reference: : : :Nisshin Fire & Marine Insurance Co., Ltd. (non-consolidated)
Statement of income
(Yen in millions)
114,298 111,742 (2,556) 111,858 110,083 (1,774)
Net premiums written
105,826 105,940 113
Deposit premiums from policyholders
1,732 1,529 (202)
Investment income on deposit premiums
1,491 1,537 46
Reversal of underwriting reserves
2,767 1,063 (1,704) 2,191 1,603 (587)
Interest and dividends
3,366 2,979 (387)
Gains on sales of securities
291 138 (152)
Transfer of investment income on deposit premiums
(1,491) (1,537) (46) 248 55 (193) 108,631 106,227 (2,403) 91,072 88,076 (2,996)
Net claims paid
56,994 54,557 (2,437)
Loss adjustment expenses
7,498 7,509 11
Agency commissions and brokerage
17,001 17,538 537
Maturity refunds to policyholders
8,134 7,240 (894)
Provision for outstanding claims
1,348 1,060 (288) 181 186 4
Losses on sales of securities
86 2 (83)
Impairment losses on securities
19 30 10
Losses on redemption of securities
1 36 34 17,307 17,426 119 69 537 468 5,667 5,515 (152) 33 2 (31)
Gains on disposal of fixed assets
33 2 (31) 315 176 (138)
Losses on disposal of fixed assets
33 71 37
Impairment losses on fixed assets
108
Provision for reserves under special laws
172 104 (67)
Provision for price fluctuation reserve
172 104 (67) 5,385 5,341 (44) 1,740 1,834 93 (169) (326) (156) 1,571 1,508 (63) 3,814 3,832 18
(Reference)
4,067 5,192 1,124 60.9 % 58.6 % (2.4) %
Expense ratio (W/P basis)
32.1 32.8 0.6
Combined ratio (W/P basis)
93.1 91.3 (1.7)
Loss ratio (private sector, E/I basis)
59.0 55.1 (3.9)
Expense ratio (private sector)
33.8 34.2 0.5
Combined ratio (private sector)
92.8 89.3 (3.5)
Extraordinary losses Ordinary expenses Ordinary profit Extraordinary gains Other ordinary expenses Operating and general administrative expenses Investment expenses Loss ratio (W/P basis) Underwriting profit Net income Income before income taxes Income taxes - current Total income taxes Income taxes - deferred Underwriting expenses Nine months ended December 31, 2015 ( April 1, 2015 to December 31, 2015 ) Increase (Decrease) Other ordinary income Nine months ended December 31, 2016 ( April 1, 2016 to December 31, 2016 ) Investment income Ordinary income Underwriting income
Tokio Marine Holdings, Inc. 17
SLIDE 20 Reference: : : :Nisshin Fire & Marine Insurance Co., Ltd. (non-consolidated)
Underwriting
Direct premiums written excluding deposit premiums from policyholders (Yen in millions) % % % % Fire and allied lines 20,391 17.6 5.7 18,999 16.8 (6.8) Hull and cargo
7,229 6.3 (4.0) 7,046 6.2 (2.5)
Voluntary automobile
64,305 55.6 2.6 64,374 56.9 0.1
Compulsory automobile liability
16,252 14.1 0.1 15,209 13.4 (6.4)
Others
7,479 6.5 3.1 7,585 6.7 1.4
Total
115,658 100.0 2.4 113,215 100.0 (2.1)
Deposit premiums from policyholders
1,732
1,529
Net premiums written (Yen in millions) % % % % Fire and allied lines 11,597 11.0 5.3 12,640 11.9 9.0 Hull and cargo 18 0.0 (55.9) 4 0.0 (73.3) Personal accident 7,150 6.8 (4.0) 6,982 6.6 (2.3) Voluntary automobile 64,155 60.6 2.7 64,248 60.6 0.1 Compulsory automobile liability 15,660 14.8 2.5 14,713 13.9 (6.0) Others 7,246 6.8 3.7 7,349 6.9 1.4 Total 105,826 100.0 2.5 105,940 100.0 0.1 Net claims paid (Yen in millions) % % % % Fire and allied lines 8,492 (15.4) 77.4 6,922 (18.5) 58.1 Hull and cargo 20 (30.5) 113.4 8 (56.8) 196.3 Personal accident 3,266 (4.7) 49.9 2,850 (12.7) 44.7 Voluntary automobile 30,728 2.0 56.2 30,672 (0.2) 56.2 Compulsory automobile liability 11,576 (1.1) 80.5 11,359 (1.9) 84.2 Others 2,909 (6.4) 44.9 2,743 (5.7) 41.8 Total 56,994 (2.5) 60.9 54,557 (4.3) 58.6 (Note) Loss ratio is calculated on W/P basis. ( April 1, 2016 to December 31, 2016 ) ( April 1, 2015 to December 31, 2015 ) ( April 1, 2016 to December 31, 2016 ) Rate of change Amount Amount Composition ratio Nine months ended December 31, 2016 Amount ( April 1, 2016 to December 31, 2016 ) Rate of change Composition ratio Composition ratio Rate of change Nine months ended December 31, 2016 Nine months ended December 31, 2015 Nine months ended December 31, 2015 Rate of change Amount ( April 1, 2015 to December 31, 2015 ) Composition ratio Loss ratio Nine months ended December 31, 2016 Amount Loss ratio Nine months ended December 31, 2015 Amount Rate of change Rate of change ( April 1, 2015 to December 31, 2015 )
Tokio Marine Holdings, Inc. 18
SLIDE 21 Reference: : : :Nisshin Fire & Marine Insurance Co., Ltd. (non-consolidated)
Solvency margin ratio (non-consolidated)
(Yen in millions) (A) Total amount of solvency margin
168,628 180,284 61,405 65,238
Price fluctuation reserve
1,374 1,479
Contingency reserve
55,905 59,506
General allowance for doubtful accounts
5 4 43,625 45,960
Unrealized gains (losses) on land
(732) (434)
Excess of policyholders' contract deposits
- Subordinated debt, etc.
- Deductions
- Others
7,045 8,529
(B) Total amount of risks (R1+R2)2+(R3+R4)2+R5+R6
29,904 25,626
General insurance risk (R1)
12,289 12,345
Third sector insurance risk (R2)
- Assumed interest rate risk
(R3)
1,110 1,086
Asset management risk (R4)
12,934 13,696
Business administration risk (R5)
736 656
Catastrophe risk (R6)
10,504 5,710
(C) Solvency margin ratio [(A)/{(B)×1/2}]×100
1,127.7% 1,406.9%
(Note) Solvency margin ratio as of December 31, 2016 was calculated by methods which the company regarded as reasonable in conformity with the Insurance Business Act and other related regulations. Catastrophe risk was calculated partially based on simplified methods including but not limited to use of data as of September 30, 2016. Unrealized gains (losses) on available-for-sale securities and deferred gains (losses)
- n hedge transactions (prior to tax effect deductions)
As of March 31, 2016 As of December 31, 2016 Shareholders' equity less adjusting items Amounts within "Excess of policyholders' contract deposits" and "Subordinated debt, etc." not calculated into the margin
Tokio Marine Holdings, Inc. 19
SLIDE 22 Reference: : : :E.design Insurance Co., Ltd. (non-consolidated)
Balance sheet
(Yen in millions)
% % 27,324 64.24 30,772 70.91 3,447 115 0.27 143 0.33 28 0.00 0.00
35.49 12,482 28.76 (2,614) 11,480 8,610 (2,870) 3,615 3,871 256
Total assets
42,536 100.00 43,398 100.00 862 20,629 48.50 24,898 57.37 4,269 7,659 10,463 2,804 12,970 14,434 1,464 3,406 8.01 2,884 6.65 (522) 29 21 (7) 36 34 (1) 35 49 13 3,305 2,778 (527) 97 0.23 129 0.30 31 125 0.30 60 0.14 (65) 0.00 1 0.00 24,259 57.03 27,973 64.46 3,713 24,803 58.31 25,903 59.69 1,099 24,803 58.31 25,903 59.69 1,099 24,803 25,903 1,099 (31,331) (73.66) (36,382) (83.83) (5,051) (31,331) (36,382) (5,051) (31,331) (36,382) (5,051) 18,276 42.97 15,424 35.54 (2,851) 18,276 42.97 15,424 35.54 (2,851) 42,536 100.00 43,398 100.00 862
Asset retirement obligations Other retained earnings Capital surplus Share capital Other liabilities Provision for retirement benefits Provision for employees' bonus Lease obligations Income taxes payable Insurance liabilities Other liabilities Underwriting reserves Outstanding claims Other assets Intangible fixed assets Total liabilities and net assets Deferred tax liabilities Total shareholders' equity Total net assets Retained earnings carried forward Net assets Total liabilities Additional paid-in capital Retained earnings Tangible fixed assets Liabilities Other assets Deferred assets under Article 113 of the Insurance Business Act Increase (Decrease) Assets Amount As of March 31, 2016 As of December 31, 2016 Composition ratio Amount Composition ratio Cash and bank deposits
Tokio Marine Holdings, Inc. 20
SLIDE 23 Reference: : : :E.design Insurance Co., Ltd. (non-consolidated)
Statement of income
(Yen in millions)
15,013 18,655 3,642 15,007 18,651 3,643 15,000 18,641 3,640 7 10 3 (0) (5) (5) 6 4 (2) (7) (10) (3) 6 9 3 20,339 23,697 3,358 12,479 15,566 3,086 7,890 10,059 2,168 1,140 1,223 82 8 13 5 1,854 2,804 949 1,585 1,464 (120) 4,988 5,258 269 2,871 2,873 1 (0) 2,870 2,870
(5,041) 284 (5,325) (5,041) 284 7 9 1 (0) 7 9 2 (5,332) (5,051) 281 (Reference) (2,460) (2,172) 287 60.2 % 60.5 % 0.3 % 33.3 28.3 (5.0)
Combined ratio (W/P basis)
93.5 88.8 (4.7)
Loss ratio (private sector, E/I basis)
80.4 82.5 2.2
Expense ratio (private sector)
33.8 28.6 (5.2) 114.2 111.2 (3.0)
December 31, 2016) Increase (Decrease) Nine months ended December 31, 2015 (April 1, 2016 to Nine months ended December 31, 2016 (April 1, 2015 to Other ordinary income Transfer of investment income on deposit premiums December 31, 2015) Underwriting income Investment income Interest and dividends Net premiums written Investment income on deposit premiums Ordinary income Income taxes - current Income (loss) before income taxes Other ordinary expenses Interest expenses Operating and general administrative expenses Ordinary expenses Underwriting expenses Provision for outstanding claims Provision for underwriting reserves Agency commissions and brokerage Net claims paid Loss adjustment expenses Combined ratio (private sector) Total income taxes Net income (loss) Underwriting profit (loss) Loss ratio (W/P basis) Expense ratio (W/P basis) Income taxes - deferred Amortization of deferred assets under Article 113
- f the Insurance Business Act
Ordinary profit (loss)
Tokio Marine Holdings, Inc. 21
SLIDE 24 Reference: : : :Tokio Marine & Nichido Life Insurance Co., Ltd. (non-consolidated)
Balance sheet
(Yen in millions)
239,071 3.44 109,310 1.45 (129,761) 21,597 0.31 21,261 0.28 (335) 252,985 3.64 235,997 3.13 (16,987) 6,217,055 89.47 6,952,822 92.14 735,767 4,927,407 5,763,009 835,602
3,000 35,431 77,222 41,790 234 234
527,615 195,389 921,756 581,740 (340,015) 79,717 1.15 82,592 1.09 2,874 79,717 82,592 2,874 1,129 0.02 1,382 0.02 252 27 0.00 27 0.00
0.00 202 0.00 (23) 4,678 0.07 3,303 0.04 (1,374) 133,189 1.92 139,644 1.85 6,455 (754) (0.01) (773) (0.01) (19) 6,948,924 100.00 7,545,771 100.00 596,846 5,745,926 82.69 5,857,372 77.62 111,446 38,800 45,795 6,994 5,604,817 5,708,622 103,804 102,307 102,955 647 7,263 0.10 5,526 0.07 (1,736) 3,527 0.05 2,564 0.03 (963) 745,965 10.73 1,313,479 17.41 567,513 704,077 1,141,546 437,468 1,210 673 (537) 157 242 84 40,519 171,017 130,497 4,877 0.07 5,558 0.07 681 5,709 0.08 6,283 0.08 573 5,709 6,283 573 39,607 0.57 19,865 0.26 (19,742) 6,552,877 94.30 7,210,649 95.56 657,771 55,000 0.79 55,000 0.73
0.97 55,095 0.73 (12,000) 39,460 41,860 2,400 27,635 13,235 (14,400) 33,594 0.48 35,455 0.47 1,861 8,300 10,300 2,000 25,294 25,155 (138) 25,294 25,155 (138) 155,689 2.24 145,550 1.93 (10,138) 232,489 3.35 182,482 2.42 (50,007) 7,867 0.11 7,088 0.09 (778) 240,357 3.46 189,571 2.51 (50,785) 396,047 5.70 335,122 4.44 (60,924) 6,948,924 100.00 7,545,771 100.00 596,846
Share capital Capital surplus Deferred gains (losses) on hedge transactions Total valuation and translation adjustments Additional paid-in capital Other capital surplus Other retained earnings Retained earnings carried forward Total shareholders' equity Unrealized gains (losses) on available-for-sale securities Retained earnings Surplus reserve Outstanding claims Underwriting reserves Reserve for dividends to policyholders Agency accounts payable Reinsurance accounts payable Income taxes payable Agency accounts receivable Reinsurance accounts receivable Other assets Other liabilities Payables under securities lending transactions Allowance for doubtful accounts Insurance liabilities Deferred tax liabilities Provision for retirement benefits Reserves under special laws Price fluctuation reserve Lease obligations Other liabilities Others Tangible fixed assets Intangible fixed assets Domestic equity securities Foreign securities
% %
Securities Domestic government bonds Domestic municipal bonds Domestic corporate bonds Composition ratio Composition ratio Monetary receivables bought Increase (Decrease) Cash and bank deposits As of March 31, 2016 Amount Amount As of December 31, 2016 Net assets Total net assets Total liabilities and net assets Assets Total assets Liabilities Total liabilities Loans Policy loans Receivables under securities borrowing transactions
Tokio Marine Holdings, Inc. 22
SLIDE 25 Reference: : : :Tokio Marine & Nichido Life Insurance Co., Ltd. (non-consolidated)
Statement of income
(Yen in millions)
795,829 729,309 (66,520) 584,255 617,151 32,896 573,419 603,353 29,933 80,242 108,533 28,291 65,164 70,443 5,278 6,010 3,629 (2,380) 5,741
10,519 3,261 23,910 20,648 131,331 3,624 (127,707) 349
126,878
767,284 708,355 (58,928) 668,421 485,361 (183,059) 43,122 38,060 (5,062) 30,494 44,220 13,726 107,777 210,583 102,805 372,270 163,256 (209,014) 91,072 11,013 (80,059) 110,799 110,799
6,994
103,804 5,632 13,899 8,267 428 541 112 424 3,286 2,862 21
10,048 4,756
86,905 91,595 4,689 6,324 6,698 374 28,545 20,953 (7,591) 439 614 174 4,407 3,508 (898) 23,698 16,830 (6,867) 2,151 4,962 2,810 4,834 7 (4,827) 6,986 4,969 (2,016) 16,712 11,861 (4,851)
Benefits Surrender benefits Other refunds Interest expenses Reversal of outstanding claims Reversal of underwriting reserves Insurance claims Annuity payments Gains on sales of securities Gains on derivatives Foreign exchange gains Investment gains on separate accounts Income taxes - current Income taxes - deferred Investment expenses Operating expenses Losses on sales of securities Impairment losses on securities Losses on derivatives Foreign exchange losses Ordinary income Insurance premiums and other Provision for underwriting reserves and other Provision for outstanding claims Investment income Other ordinary income Ordinary expenses Insurance claims and other Insurance premiums Interest and dividends Provision for underwriting reserves Interest on reserve for dividends to policyholders Total income taxes Net income Extraordinary losses Provision for reserve for dividends to policyholders Income before income taxes Other ordinary expenses Ordinary profit Increase (Decrease) Nine months ended December 31, 2015 (April 1, 2015 to December 31, 2015) (April 1, 2016 to December 31, 2016) Nine months ended December 31, 2016
Tokio Marine Holdings, Inc. 23
SLIDE 26 Reference: : : :Tokio Marine & Nichido Life Insurance Co., Ltd. (non-consolidated)
Breakdown of ordinary profit (Core operating profit)
(Yen in millions) A
21,979 24,059 2,080 10,526 14,149 3,623 6,010 3,629 (2,380) 4,515
10,519 5,453 15,385 9,931 424 3,286 2,862 21
11,539 4,756
Other capital losses
251 559 307
B
5,072 (1,235) (6,308)
A+B
27,051 22,823 (4,228) 1,505
1,505
12 1,869 1,857
1,849 12 20 8
C
1,493 (1,869) (3,363)
A+B+C
28,545 20,953 (7,591)
(Note) Losses on sales of securities Impairment losses on securities Losses on derivatives Foreign exchange losses Net capital gains (losses) Core operating profit including net capital gains (losses) Non-recurring income (April 1, 2016 to December 31, 2016) Nine months ended December 31, 2016 Increase (Decrease) Capital losses Nine months ended December 31, 2015 Core operating profit Capital gains Gains on sales of securities Gains on derivatives Foreign exchange gains (April 1, 2015 to December 31, 2015) Non-recurring losses Provision for contingency reserves Reversal of contingency reserves Increase in specific allowance for doubtful accounts Net non-recurring income (losses) Ordinary profit
- 1. Net gains of interest received/paid on interest swaps of 1,225 million yen and 1,490 million yen presented as Gains/Losses on derivatives on
statement of income are included in Core operating profit for the nine months ended December 31, 2015 and December 31, 2016, respectively.
- 2. Other capital losses represents increase in underwriting reserves for foreign-currency insurance contracts due to exchange rate fluctuations,
and it is included in Provision for underwriting reserves and Reversal of underwriting reserves on statement of income.
Tokio Marine Holdings, Inc. 24
SLIDE 27 Reference: : : :Tokio Marine & Nichido Life Insurance Co., Ltd. (non-consolidated)
Amount of policies
Policies in force (Number in thousands, yen in 100 millions) New policies (Number in thousands, yen in 100 millions)
Annualized premiums
Policies in force (Yen in 100 millions) New policies (Yen in 100 millions) Number of policies Amount Number of policies Amount Number of policies Amount Number of policies ( April 1, 2016 to December 31, 2016 ) ( April 1, 2015 to December 31, 2015 ) Nine months ended December 31, 2016
% to March 31, 2016 % to December 31, 2015 % to December 31, 2014 % to December 31, 2015 % to December 31, 2015
As of December 31, 2016 As of March 31, 2016 ( April 1, 2016 to December 31, 2016 ) Nine months ended December 31, 2016
75.8 93.7 104.5
March 31, 2016
661
As of December 31, 2016
121.0 33 97.9 94.4 24,825 385
Amount
92.1 24.5
13 70.6
% to March 31, 2016
29,481 25,694 255,967 104.0 107.8 107.9
27.0 1,359 91.1 71.9 101.6 104.5 96.2 118.3 109.6 93.8 33.3
Total Individual annuities
113.3 5,650
Individual insurance
7,965 2,315
Individual annuities Individual insurance
115.3
% to December 31, 2014
( April 1, 2015 to December 31, 2015 ) Nine months ended December 31, 2015 Medical and cancer Total Medical coverage and accelerated death benefits, etc.
816
Individual annuities Medical and cancer
1,259
Medical coverage and accelerated death benefits, etc. Group annuities Group insurance Individual insurance
408 106.7 91.7 26,068 105.8 89.8 34 98.2
Group annuities
4,601
% to March 31, 2015
107.9
Individual insurance
705
Group insurance As of March 31, 2016
246,086
% to March 31, 2015
95.2
32,015
% to December 31, 2014
Nine months ended December 31, 2015
2,723
2,069 8,122 107.1 89.4 102.0
% to March 31, 2015
1,576 87.1 20,517
349 6,052 1,461 113.6
168 724 40 765 178 153 122.5 122 693 Tokio Marine Holdings, Inc. 25
SLIDE 28 Reference: : : :Tokio Marine & Nichido Life Insurance Co., Ltd. (non-consolidated)
Solvency margin ratio (non-consolidated)
(Yen in millions) (A) Total amount of solvency margin
858,471 830,542 133,689 146,033
Price fluctuation reserve
5,709 6,283
Contingency reserve
45,094 46,943
General allowance for doubtful accounts
471 473
Unrealized gains (losses) on land × 85% (× 100% in case of net unrealized losses)
- Excess of continued Zillmerized reserve
286,376 303,655
Subordinated debt, etc.
Deductions
101,785 106,614
(B) Total amount of risks (R1+R8)2+(R2+R3+R7)2+R4
50,825 49,890
Insurance risk (R1)
14,891 15,407
Third sector insurance risk (R8)
4,655 5,040
Assumed interest rate risk (R2)
4,988 4,981
Minimum guarantee risk (R7)
3,018 3,061
Asset management risk (R3)
37,496 36,045
Business administration risk (R4)
1,301 1,290
(C) Solvency margin ratio [(A)/{(B)×1/2}]×100
3,378.1% 3,329.4%
As of March 31, 2016 As of December 31, 2016 Shareholders' equity less adjusting items Amounts within "Excess of continued Zillmerized reserve" and "Subordinated debt, etc." not calculated into the margin Unrealized gains (losses) on available-for-sale securities and deferred gains (losses)
- n hedge transactions (prior to tax effect deductions) × 90%
(× 100% in case of net loss)
(5,266) (107,563) 290,612 228,103 Tokio Marine Holdings, Inc. 26
SLIDE 29 Glossary of terminology
- Underwriting profit (loss)
Underwriting profit (loss) = Underwriting income - (Underwriting expenses + Operating and general administrative expenses on underwriting) ± other miscellaneous income and expenses (*) * Mainly consist of income taxes relating to compulsory automobile liability insurance.
Loss ratio (W/P basis) = (Net claims paid + Loss adjustment expenses) / Net premiums written × 100
- Expense ratio (W/P basis)
Expense ratio (W/P basis) = (Agency commissions and brokerage + Operating and general administrative expenses
- n underwriting) / Net premiums written × 100
- Combined ratio (W/P basis)
Combined ratio (W/P basis) = Loss ratio (W/P basis) + Expense ratio (W/P basis)
- Loss ratio (private sector (*1), E/I basis)
Loss ratio (private sector, E/I basis) = (Net claims paid + Outstanding claims as of the end of current period - Outstanding claims as of the end of previous fiscal year + Loss adjustment expenses) / Earned premiums (*2) × 100 *1 Excluding earthquake insurance under the Law concerning Earthquake Insurance and compulsory automobile liability insurance. *2 Earned premiums = Net premiums written - Unearned premiums as of the end of current period (*3) + Unearned premiums as of the end of previous fiscal year (*3) *3 Unearned premiums are premiums corresponding to the remaining duration on insurance policies at the end of the period.
- Expense ratio (private sector)
Expense ratio (private sector) = (Agency commissions and brokerage + Operating and general administrative expenses on underwriting) / Net premiums written × 100
- Combined ratio (private sector)
Combined ratio (private sector) = Loss ratio (private sector, E/I basis) + Expense ratio (private sector)
Tokio Marine Holdings, Inc. 27
SLIDE 30
- Amount of policies in force
- Individual insurance and group insurance
Total amount of death benefits under policies in force at the end of the period.
① Individual annuities whose payments have not yet commenced: amount of funds for annuity payments that is expected to have accrued at commencement of annuity payments. ② Individual annuities whose payments have already commenced: amount of underwriting reserves.
Amount of underwriting reserves.
- Amount of new policies
- Individual insurance and group insurance
Total amount of death benefits under new policies issued during the period.
Amount of funds for annuity payments that is expected to have accrued at commencement of annuity payments for new policies issued during the period.
First installment of premium payments.
Annualized premiums are amounts of premiums per year calculated by dividing aggregate amounts of premiums by the duration of insurance policies.
- Medical coverage and accelerated death benefits, etc.
Medical coverage and accelerated death benefits, etc. includes coverage for medical expense (e.g. hospitalization and operation), accelerated death benefits (e.g. specific diseases and nursing care) and exemption of obligation to pay insurance premiums (excluding those caused by disability but including those caused by specific diseases and nursing care, etc.).
- Solvency margin ratio
- In addition to reserves to cover claim payments and payments for maturity-refunds of saving type insurance
policies, etc., it is necessary for insurance companies to maintain sufficient solvency in order to cover against risks which exceed normal expectations, e.g. occurrences of major catastrophe, a significant decline in value of assets held by insurance companies.
- (C) Solvency margin ratio is the ratio of (A) Total amount of solvency margin (i.e. solvency of insurance
companies in terms of their capital, reserves, etc.) to (B) Total amount of risks (i.e. risks which exceed normal expectations), which is calculated in accordance with the Insurance Business Act.
Tokio Marine Holdings, Inc. 28
SLIDE 31
- "Risks which exceed normal expectations" is composed of risks described below.
① (General) insurance risk, third sector insurance risk: risks that insurance claims occur beyond normal expectations (excluding catastrophe risk). ② Assumed interest rate risk: risks that invested assets fail to yield assumed interest rates due to the aggravation of investment conditions. ③ Minimum guarantee risk: risks that value of assets related to the minimum guarantee for benefits of insurance contracts which are managed as a separate account fluctuates beyond normal expectations and falls below the minimum guaranteed benefits when they are to be paid. ④ Asset management risk: risks that the prices of retained securities and other assets fluctuate beyond normal expectations. ⑤ Business administration risk: risks that occur beyond normal expectations that do not fall under other categories. ⑥ Catastrophe risk: risks that major catastrophe beyond normal expectations (equivalent to the Great Kanto Earthquake or Isewan typhoon) occurs.
- Solvency of insurance companies in terms of their capital, reserves, etc. ((A) Total amount of solvency margin) is
the total amount of net assets (excluding planned outflows), certain reserves (price fluctuation reserve, contingency reserve and catastrophe loss reserve, etc.) and part of unrealized gains (losses) on land.
- Solvency margin ratio is one of the objective indicators used by the regulatory authority to supervise insurance
- companies. Ratio exceeding 200% indicates sufficient solvency to fulfill payment obligations such as insurance
claims.
Tokio Marine Holdings, Inc. 29