
SLIDE 1
May 19, 2011
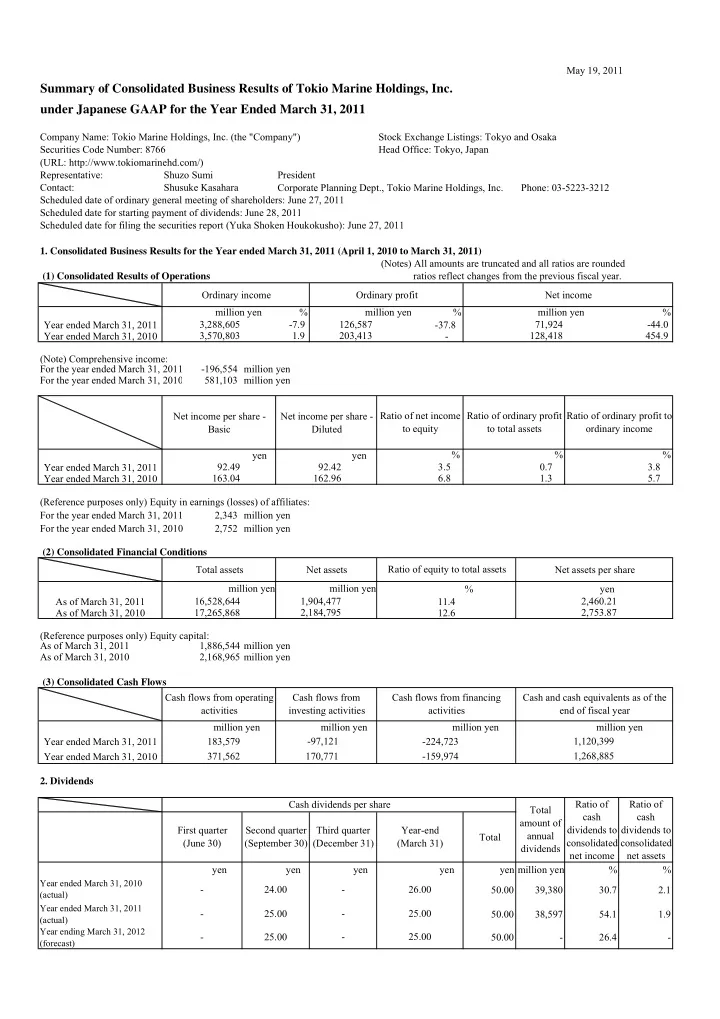
Summary of Consolidated Business Results of Tokio Marine Holdings, Inc. under Japanese GAAP for the Year Ended March 31, 2011
(URL: http://www.tokiomarinehd.com/) Representative: Shuzo Sumi President Contact: Shusuke Kasahara Scheduled date of ordinary general meeting of shareholders: June 27, 2011 Scheduled date for starting payment of dividends: June 28, 2011
- 1. Consolidated Business Results for the Year ended March 31, 2011 (April 1, 2010 to March 31, 2011)
(Notes) All amounts are truncated and all ratios are rounded (1) Consolidated Results of Operations ratios reflect changes from the previous fiscal year. Ordinary income Ordinary profit Net income million yen % million yen % million yen % Year ended March 31, 2011
- 37.8
Year ended March 31, 2010
- (Note) Comprehensive income:
For the year ended March 31, 2011
- 196,554 million yen
For the year ended March 31, 2010 581,103 million yen Net income per share - Basic Net income per share - Diluted yen yen % % % Year ended March 31, 2011 Year ended March 31, 2010 (Reference purposes only) Equity in earnings (losses) of affiliates: For the year ended March 31, 2011 2,343 million yen For the year ended March 31, 2010 2,752 million yen (2) Consolidated Financial Conditions Total assets Net assets Net assets per share % yen As of March 31, 2011 11.4 As of March 31, 2010 12.6 (Reference purposes only) Equity capital: As of March 31, 2011 1,886,544 million yen As of March 31, 2010 2,168,965 million yen (3) Consolidated Cash Flows Year ended March 31, 2011 Year ended March 31, 2010
- 2. Dividends
Total yen yen yen yen yen million yen % %
Year ended March 31, 2010 (actual)
50.00 39,380 30.7 2.1
Year ended March 31, 2011 (actual)
50.00 38,597 54.1 1.9
Year ending March 31, 2012 (forecast)
50.00
- 26.4
- Scheduled date for filing the securities report (Yuka Shoken Houkokusho): June 27, 2011
183,579
- 25.00
170,771 25.00 17,265,868 Cash flows from financing activities 1,904,477 Cash flows from operating activities 371,562 First quarter (June 30) Second quarter (September 30)
- 224,723
- 159,974
1.3 Ratio of equity to total assets million yen Cash and cash equivalents as of the end of fiscal year 2,753.87 24.00 million yen Ratio of ordinary profit to total assets 1.9 Ratio of ordinary profit to
- rdinary income
- 44.0
454.9 Ratio of net income to equity 203,413 16,528,644 2,460.21 million yen million yen 3.8 92.42 162.96 3.5 5.7 6.8 Company Name: Tokio Marine Holdings, Inc. (the "Company") Stock Exchange Listings: Tokyo and Osaka Securities Code Number: 8766 Head Office: Tokyo, Japan 3,288,605 71,924 Corporate Planning Dept., Tokio Marine Holdings, Inc. Phone: 03-5223-3212 126,587
- 7.9
3,570,803
- 97,121
million yen Cash flows from investing activities 1,120,399 128,418 2,184,795 0.7 92.49 163.04 million yen Ratio of cash dividends to consolidated net income Total amount of annual dividends 25.00 25.00
- 26.00
- Year-end