SLIDE 1 Summary of Consolidated Business Results of Tokio Marine Holdings, Inc. under Japanese GAAP for the six months ended September 30, 2015
November 18, 2015 Company Name: Tokio Marine Holdings, Inc. (the "Company") Stock Exchange Listing: Tokyo Securities Code Number: 8766 (URL: http://www.tokiomarinehd.com/) Representative: Tsuyoshi Nagano, President Contact: Jun Ehara, Corporate Planning Dept. Tel: 03-5223-3212 Scheduled date for filing the quarterly securities report for the six months ended September 30, 2015: November 24, 2015 Scheduled date for starting payment of dividends: December 2, 2015 Supplementary information for quarterly financial statements: Available Quarterly IR Conference Call: To be held (for analysts) (Note) All amounts are truncated and all percentages are rounded.
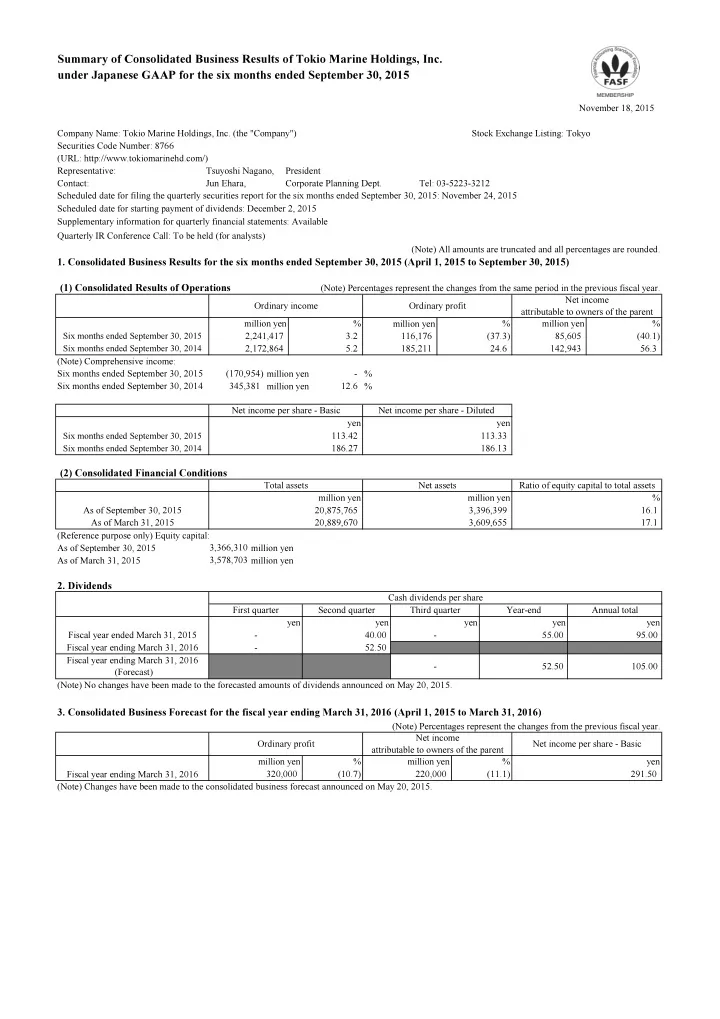
- 1. Consolidated Business Results for the six months ended September 30, 2015 (April 1, 2015 to September 30, 2015)
(Note) Percentages represent the changes from the same period in the previous fiscal year. (Note) Comprehensive income: Six months ended September 30, 2015 million yen % Six months ended September 30, 2014 million yen % (Reference purpose only) Equity capital: As of September 30, 2015 million yen As of March 31, 2015 million yen
- 2. Dividends
- 3. Consolidated Business Forecast for the fiscal year ending March 31, 2016 (April 1, 2015 to March 31, 2016)
(Note) Percentages represent the changes from the previous fiscal year. Third quarter
(37.3) 2,241,417 3.2 (Note) No changes have been made to the forecasted amounts of dividends announced on May 20, 2015. 2,172,864 5.2 185,211 Six months ended September 30, 2015 113.42 Net assets Six months ended September 30, 2014 186.27 186.13 24.6 (Note) Changes have been made to the consolidated business forecast announced on May 20, 2015. % (11.1) million yen Ordinary profit Ordinary income Net income per share - Basic Net income per share - Diluted % % Six months ended September 30, 2015 Six months ended September 30, 2014 320,000 Fiscal year ending March 31, 2016 3,578,703 Cash dividends per share Second quarter Ordinary profit million yen million yen yen 345,381 (170,954) 113.33
yen As of September 30, 2015 20,875,765 Total assets million yen Year-end yen yen 3,366,310 As of March 31, 2015 16.1 3,396,399 yen yen yen Annual total 20,889,670 Fiscal year ended March 31, 2015 Fiscal year ending March 31, 2016 Fiscal year ending March 31, 2016 (Forecast) 40.00 First quarter 105.00
52.50 3,609,655 17.1 Ratio of equity capital to total assets million yen % Net income attributable to owners of the parent million yen % 85,605 (40.1) 142,943 56.3
(2) Consolidated Financial Conditions (1) Consolidated Results of Operations
Net income attributable to owners of the parent Net income per share - Basic yen 291.50 (10.7) % million yen 220,000
SLIDE 2 *Notes
(1) Significant changes with respect to the subsidiaries of the Company (changes in Specified Subsidiaries that resulted in a change in the scope of consolidation) during the six months ended September 30, 2015: None (2) Changes in accounting policies, changes in accounting estimates, and retrospective restatements (a) Changes in accounting policies to reflect amendments of accounting standards and related matters: Yes (b) Changes in accounting policies other than (a): None (c) Changes in accounting estimates: None (d) Retrospective restatements: None (Note) Please see Appendix p. 3 "Changes in accounting policies, changes in accounting estimates, and retrospective restatements" for details. (3) Number of shares issued (common share) (a) Total number of the shares issued (including treasury shares) As of September 30, 2015 shares As of March 31, 2015 shares (b) Number of treasury shares held As of September 30, 2015 shares As of March 31, 2015 shares (c) Average number of shares outstanding During the six months ended September 30, 2015 shares During the six months ended September 30, 2014 shares
Summary of Non-consolidated Business Results of Tokio Marine Holdings, Inc. under Japanese GAAP for the six months ended September 30, 2015
- 1. Non-consolidated Business Results for the six months ended September 30, 2015 (April 1, 2015 to September 30, 2015)
(Note) Percentages represent the changes from the same period in the previous fiscal year.
(2) Non-consolidated Financial Conditions
(Reference purpose only) Equity capital: As of September 30, 2015 million yen As of March 31, 2015 million yen
- 2. Non-consolidated Business Forecast for the fiscal year ending March 31, 2016 (April 1, 2015 to March 31, 2016)
(Note) Percentages represent the changes from the previous fiscal year.
*Disclosure regarding the execution of the interim audit process
This "Summary of Consolidated Business Results" is outside the scope of the external auditor’s interim audit procedure required by the Financial Instruments and Exchange Act. The interim audit process has not been completed as of the date of the disclosure in the "Summary
- f Consolidated Business Results".
*Notes concerning the business forecast and other items
- 1. Any business forecasts contained in this document are based on information available to the Company as of the date of this document and certain
assumptions, and actual results may materially differ from the forecasts depending upon various factors.
- 2. The Company prepared its consolidated and non-consolidated interim financial statements for the six months ended September 30, 2015 because it is a
"specific business company" as defined in Article 17-15, paragraph 2 of the Cabinet Office Ordinance on Disclosure of Company Information. 754,695,938 2,829,699 2,925,459 757,524,375 757,524,375 2,470,356 2,509,565
(1) Non-consolidated Results of Operations
yen % 767,367,726 Fiscal year ending March 31, 2016 Operating income 97,000 (35.2) % million yen 2,505,305 As of March 31, 2015 8.41 48,531 Six months ended September 30, 2015 Six months ended September 30, 2014 Net income per share - Basic Ordinary profit % million yen 87,500 (38.5) % yen million yen % 291.4 45,012 291.0 45,014 Ratio of equity capital to total assets 99.8 Net income Operating income Operating profit million yen million yen % Ordinary profit % million yen million yen 30,342 (32.5) Six months ended September 30, 2015 Six months ended September 30, 2014 34,711 (28.5) 44,940 220.9 Total assets Net assets 58.66 As of September 30, 2015 2,474,521 million yen 2,472,478 million yen 63,500 (55.2) 84.13 Net income Net income per share - Basic 2,507,342 6,347 (85.9) 290.8 30,364 (32.5) 99.8 %
SLIDE 3 Contents of Appendix
- 1. Qualitative information concerning the consolidated business results for the six months ended
September 30, 2015 ····················································································2 (1) Qualitative information concerning the consolidated results of operations ···················2 (2) Qualitative information concerning the consolidated financial condition ·····················2 (3) Qualitative information concerning the consolidated business forecast ·······················2
- 2. Information concerning Summary (Notes) ·························································3
Changes in accounting policies, changes in accounting estimates, and retrospective restatements ·····························································································3
- 3. Consolidated Financial Statements ··································································4
(1) Consolidated Balance Sheet ··········································································4 (2) Consolidated Statement of Income and Consolidated Statement of Comprehensive Income·5 (3) Consolidated Statement of Changes in Shareholders' Equity·····································8 (4) Notes regarding going concern assumption ····················································· 10 (5) Business combinations and other matters ························································ 10
- 4. Supplementary information ········································································· 11
(1) Summary of Consolidated Business Results······················································ 11 (2) Premiums written and claims paid by lines of business ········································ 12 (3) Securities ···························································································· 13 (4) Derivative financial instruments ·································································· 15
Tokio Marine Holdings, Inc. 1
SLIDE 4
- 1. Qualitative information concerning the consolidated business results for the six months
ended September 30, 2015 (1) Qualitative information concerning the consolidated results of operations During the six months ended September 30, 2015, while the European and U.S. economies continued to gradually improve, the world economy grew slowly as a whole due to economic slowdown in some developing countries, including China. In Japan, economic recovery was at a standstill due mainly to decreases in exports and manufacturing. Under these conditions, as a result of our efforts to improve performance centered on our property and casualty and life insurance businesses, our operating results for the six months ended September 30, 2015 were as follows: Compared to the six months ended September 30, 2014, ordinary income increased by 68.5 billion yen to 2,241.4 billion yen, the main components of which were underwriting income of 1,945.0 billion yen and investment income of 244.2 billion yen. Compared to the six months ended September 30, 2014, ordinary expenses increased by 137.5 billion yen to 2,125.2 billion yen, the main components of which were underwriting expenses of 1,696.4 billion yen, investment expenses
- f 72.7 billion yen, and operating and general administrative expenses of 349.8 billion yen.
As a result, ordinary profit for the six months ended September 30, 2015 decreased by 69.0 billion yen from the same period in the prior year to 116.1 billion yen. Net income attributable to owners of the parent for the six months ended September 30, 2015, composed of ordinary profit plus extraordinary gains minus extraordinary losses and total income taxes, decreased by 57.3 billion yen from the same period in the prior year to 85.6 billion yen. (2) Qualitative information concerning the consolidated financial condition As of September 30, 2015, consolidated total assets were 20,875.7 billion yen. This represents a decrease of 13.9 billion yen from March 31, 2015, due mainly to the decrease in the domestic equities driven by the decline of Japan’s stock market, which was partly offset by the expansion of
- ur domestic and international insurance businesses.
(3) Qualitative information concerning the consolidated business forecast The Company has revised its consolidated business forecast for the fiscal year ending March 31,
- 2016. The revised consolidated business forecast is 320.0 billion yen in ordinary profit and
220.0 billion yen in net income attributable to owners of the parent. The forecast is primarily based on the following assumptions:
- With regard to net premiums written and life insurance premiums, the Company expects
3,230.0 billion yen and 330.0 billion yen respectively, based on the Company's own projections taking into consideration the business results for the six months ended September 30, 2015 and for previous years.
- As for net incurred losses relating to natural catastrophe, the Company expects 70.0 billion
yen for Tokio Marine & Nichido Fire Insurance Co., Ltd. and 5.0 billion yen for Nisshin Fire & Marine Insurance Co., Ltd., taking into consideration the actual loss emergence for the six months ended September 30, 2015 and for previous years.
Tokio Marine Holdings, Inc. 2
SLIDE 5
- In regard to interest rates, exchange rates and equity market conditions, the Company
assumes there will be no significant changes from market rates and conditions as of September 30, 2015. The forecast described above is based on the information available to the Company as of the date of this document and the assumptions above. The actual results may materially differ from the forecast depending upon various factors.
- 2. Information concerning Summary (Notes)
Changes in accounting policies, changes in accounting estimates, and retrospective restatements (Changes in accounting policies to reflect amendments of accounting standards and related matters) The Company has applied "Accounting Standard for Business Combinations" (Accounting Standards Board of Japan, hereinafter ASBJ, Statement No. 21, September 13, 2013), "Accounting Standard for Consolidated Financial Statements" (ASBJ Statement No. 22, September 13, 2013), "Accounting Standard for Business Divestitures" (ASBJ Statement No. 7, September 13, 2013), etc. since the beginning of the fiscal year 2015. As a result, the method
- f recording the amount of difference caused by changes in the Company’s ownership interests
in subsidiaries in the case of subsidiaries under ongoing control of the Company was changed to
- ne in which it is recorded as capital surplus, and the method of recording acquisition-related
costs was changed to one in which they are recognized as expenses for the fiscal year in which they are incurred. Furthermore, for business combinations carried out on or after April 1, 2015, the accounting method was changed to one in which the reviewed acquisition cost allocation resulting from the finalization of the tentative accounting treatment is reflected in the consolidated financial statements for the fiscal year in which the business combination occurs. In addition, the presentation method of net income was amended. To reflect the change in presentation, the consolidated financial statements in the previous fiscal year have been reclassified. The application of these accounting standards, which is subject to the transitional accounting treatment set forth in Clause 58-2 (4) of the Accounting Standard for Business Combinations, Clause 44-5 (4) of the Accounting Standard for Consolidated Financial Statements and Clause 57-4 (4) of the Accounting Standard for Business Divestitures, commenced since the beginning
- f the fiscal year 2015 and will continue going forward.
As a result, ordinary profit and income before income taxes and non-controlling interests for the six months ended September 30, 2015 decreased by 659 million yen, respectively.
Tokio Marine Holdings, Inc. 3
SLIDE 6
- 3. Consolidated Financial Statements
(1) Consolidated Balance Sheet
(Yen in millions) Assets 536,657 627,266 402,586 642,496 Receivables under resale agreements 64,979 462,918 24,841 9,630 1,372,372 1,416,973 2,433 4,386 15,511,017 14,958,099 695,028 418,454 282,766 278,264 408,915 398,575 1,529,803 1,604,877 408 1,086 56,568 56,050 Customers' liabilities under acceptances and guarantees 28,295 16,935 (27,005) (20,248) 20,889,670 20,875,765 Liabilities 14,328,660 14,707,211 Outstanding claims 2,204,030 2,361,326 Underwriting reserves 12,124,629 12,345,885 107,077 88,510 1,969,679 1,957,959 825,845 820,513 Other liabilities 1,143,833 1,137,446 239,838 238,016 18 19 51,615 49,356 82,945 85,076 Price fluctuation reserve 82,945 85,076 391,828 261,337 80,056 74,942 28,295 16,935 17,280,014 17,479,365 Net assets Shareholders' equity Share capital 150,000 150,000 Retained earnings 1,357,846 1,401,757 Treasury shares (11,038) (10,696) Total shareholders' equity 1,496,808 1,541,061 1,846,908 1,586,208 19,183 8,178 237,201 249,784 (21,397) (18,922) 2,081,895 1,825,249 2,037 2,121 28,915 27,967 3,609,655 3,396,399 20,889,670 20,875,765 As of March 31, 2015 As of September 30, 2015 Total net assets Share acquisition rights Non-controlling interests Corporate bonds Acceptances and guarantees Insurance liabilities Other liabilities Loans Total liabilities and net assets Tangible fixed assets Intangible fixed assets Negative goodwill Total liabilities Other assets Total assets Deferred tax assets Allowance for doubtful accounts Provision for employees' bonus Cash and bank deposits Call loans Monetary receivables bought Money trusts Securities Receivables under securities borrowing transactions Total accumulated other comprehensive income Unrealized gains on securities, net of taxes Deferred gains (losses) on hedge transactions Foreign currency translation adjustments Net defined benefit assets Remeasurements of defined benefit plans Accumulated other comprehensive income Reserves under special laws Deferred tax liabilities Payables under securities lending transactions Provision for retirement benefits for directors Net defined benefit liabilities Tokio Marine Holdings, Inc. 4
SLIDE 7 (2) Consolidated Statement of Income and Consolidated Statement of Comprehensive Income (Consolidated Statement of Income)
(Yen in millions)
Six months ended September 30, 2014 Six months ended September 30, 2015 (April 1, 2014 to September 30, 2014) (April 1, 2015 to September 30, 2015)
2,172,864 2,241,417 1,809,983 1,945,005 1,517,665 1,735,122 62,813 64,683 26,020 25,430 201,096 116,961 316,445 244,231 165,283 197,448 11 207
55,574 353 398
117,909
(25,430) 46,435 52,180 Amortization of negative goodwill 5,114 5,114 315 716 1,987,652 2,125,241 1,641,979 1,696,436 795,850 793,246 59,193 63,840 302,721 337,163 96,984 95,133 179 83 144,116 178,115 18,114 143,584 222,002 79,270 27,850 72,798 1,438 47 Losses on trading securities
5,143 6,716 2,130 4,233 436 503 13,873
311,224 349,816 6,597 6,189 3,020 3,286 444 43 1,913 1,913 185,211 116,176 Ordinary profit Losses on bad debts Amortization of deferred assets under Article 113 of the Insurance Business Act Operating and general administrative expenses Other ordinary expenses Interest expenses Losses on redemption of securities Losses on derivatives Investment losses on separate accounts Investment expenses Losses on money trusts Losses on sales of securities Impairment losses on securities Life insurance claims Provision for outstanding claims Provision for underwriting reserves Loss adjustment expenses Agency commissions and brokerage Maturity refunds to policyholders Dividends to policyholders Ordinary expenses Underwriting expenses Net claims paid Transfer of investment income on deposit premiums Other ordinary income Equity in earnings of affiliates Gains on sales of securities Gains on redemption of securities Gains on derivatives Investment gains on separate accounts Investment income Interest and dividends Gains on money trusts Gains on trading securities Ordinary income Underwriting income Net premiums written Deposit premiums from policyholders Investment income on deposit premiums Life insurance premiums Tokio Marine Holdings, Inc. 5
SLIDE 8 (Yen in millions)
Six months ended September 30, 2014 Six months ended September 30, 2015 (April 1, 2014 to September 30, 2014) (April 1, 2015 to September 30, 2015)
1,710 153 1,710 76
13,093 3,841 183 424 9,786 1,272 2,078 2,131 Provision for price fluctuation reserve 2,078 2,131 1,044 14 173,829 112,487 38,355 45,885 (8,199) (20,036) 30,156 25,848 143,672 86,638 729 1,033 142,943 85,605 Net income attributable to owners of the parent Income taxes - deferred Total income taxes Net income Net income attributable to non-controlling interests Other extraordinary losses Income before income taxes and non-controlling interests Income taxes - current Impairment losses on fixed assets Provision for reserves under special laws Extraordinary gains Gains on disposal of fixed assets Other extraordinary gains Extraordinary losses Losses on disposal of fixed assets Tokio Marine Holdings, Inc. 6
SLIDE 9
(Consolidated Statement of Comprehensive Income)
(Yen in millions)
Six months ended September 30, 2014 Six months ended September 30, 2015 (April 1, 2014 to September 30, 2014) (April 1, 2015 to September 30, 2015)
143,672 86,638 Other comprehensive income 242,608 (261,018) 236 (11,005) (43,398) 11,498 Remeasurements of defined benefit plans, net of taxes 2,565 2,474 (303) 456 Total other comprehensive income 201,708 (257,593) Total comprehensive income 345,381 (170,954) Comprehensive income attributable to: 344,898 (171,040) 482 85 Net income Unrealized gains on securities, net of taxes Non-controlling interests Deferred gains (losses) on hedge transactions Foreign currency translation adjustments Share of other comprehensive income of affiliates accounted for by the equity method Owners of the parent Tokio Marine Holdings, Inc. 7
SLIDE 10 (3) Consolidated Statement of Changes in Shareholders' Equity
Six months ended September 30, 2014 (April 1, 2014 to September 30, 2014)
(Yen in millions) Shareholders' equity Share capital Retained earnings Treasury shares Total shareholders' equity Beginning balance 150,000 1,231,034 (6,716) 1,374,318 Cumulative effects of changes in accounting policies (12,268) (12,268) Restated balance 150,000 1,218,765 (6,716) 1,362,049 Dividends (30,688) (30,688) Net income attributable to
142,943 142,943 Purchase of treasury shares (40) (40) Disposal of treasury shares (51) 489 437 Changes in the scope of consolidation
(162) (162) Net changes in items other than shareholders' equity
449 112,490 Ending balance 150,000 1,330,807 (6,267) 1,474,539 Accumulated other comprehensive income Unrealized gains
net of taxes Deferred gains (losses) on hedge transactions Foreign currency translation adjustments Remeasurements
benefit plans Beginning balance 1,239,658 18,222 106,510 (25,946) 1,891 24,459 2,739,114 Cumulative effects of changes in accounting policies (5) (12,274) Restated balance 1,239,658 18,222 106,510 (25,946) 1,891 24,453 2,726,839 Dividends (30,688) Net income attributable to
142,943 Purchase of treasury shares (40) Disposal of treasury shares 437 Changes in the scope of consolidation
(162) Net changes in items other than shareholders' equity 242,477 236 (43,323) 2,565 (121) 1,037 202,871 242,477 236 (43,323) 2,565 (121) 1,037 315,361 Ending balance 1,482,136 18,458 63,186 (23,381) 1,770 25,491 3,042,201 Non-controlling interests Total net assets Changes during the six months Total changes during the six months Changes during the six months Total changes during the six months Share acquisition rights
Tokio Marine Holdings, Inc. 8
SLIDE 11 Six months ended September 30, 2015 (April 1, 2015 to September 30, 2015)
(Yen in millions) Shareholders' equity Share capital Retained earnings Treasury shares Total shareholders' equity Beginning balance 150,000 1,357,846 (11,038) 1,496,808 Cumulative effects of changes in accounting policies
150,000 1,357,846 (11,038) 1,496,808 Dividends (41,502) (41,502) Net income attributable to
85,605 85,605 Purchase of treasury shares (83) (83) Disposal of treasury shares (133) 424 290 Changes in the scope of consolidation (130) (130) Others 73 73 Net changes in items other than shareholders' equity
341 44,252 Ending balance 150,000 1,401,757 (10,696) 1,541,061 Accumulated other comprehensive income Unrealized gains
net of taxes Deferred gains (losses) on hedge transactions Foreign currency translation adjustments Remeasurements
benefit plans Beginning balance 1,846,908 19,183 237,201 (21,397) 2,037 28,915 3,609,655 Cumulative effects of changes in accounting policies
1,846,908 19,183 237,201 (21,397) 2,037 28,915 3,609,655 Dividends (41,502) Net income attributable to
85,605 Purchase of treasury shares (83) Disposal of treasury shares 290 Changes in the scope of consolidation (130) Others 73 Net changes in items other than shareholders' equity (260,700) (11,005) 12,583 2,475 84 (947) (257,509) (260,700) (11,005) 12,583 2,475 84 (947) (213,256) Ending balance 1,586,208 8,178 249,784 (18,922) 2,121 27,967 3,396,399
(Note) "Others" consisted mainly of reclassification adjustments of deferred tax in accordance with accounting standards adopted by foreign consolidated subsidiaries, etc.
Changes during the six months Total changes during the six months Changes during the six months Total changes during the six months Share acquisition rights Non-controlling interests Total net assets
Tokio Marine Holdings, Inc. 9
SLIDE 12 (4) Notes regarding going concern assumption Not applicable. (5) Business combinations and other matters Subsequent event related to a business combination The Company acquired 100% of the outstanding shares of HCC Insurance Holdings, Inc. ("HCC"), a U.S. insurance holding company comprising property & casualty, accident & health and other specialty insurance business (hereinafter: "the Acquisition") through the Company’s wholly owned subsidiary, Tokio Marine & Nichido Fire Insurance Co., Ltd. ("TMNF").
- 1. Outline of the business combination
- a. Name of the acquired company
HCC Insurance Holdings, Inc.
Insurance group holding company
- c. Objective of the business combination
The objective of the acquisition is to establish a more solid Group business foundation. HCC has a highly profitable and diversified business portfolio that complements the Company’s existing business without significant overlap. The Acquisition will therefore further diversify the Company’s business portfolio, improve the Group’s capital efficiency, and enable sustainable profit growth.
- d. Date of the business combination
October 27, 2015
- e. Form of the business combination
Reverse triangular merger under laws concerning business combination in the U.S.
- f. Company name after combination
HCC Insurance Holdings, Inc.
- g. Voting rights acquired through the business combination
100%
- h. Primary reasons for determination of controlling company
TMNF is the controlling company, as TMNF acquired 100% of voting rights of HCC.
- 2. Acquisition cost and breakdown by class of consideration
Consideration for HCC shares acquired Cash 898,012 million yen Acquisition cost 898,012 million yen
Tokio Marine Holdings, Inc. 10
SLIDE 13
- 4. Supplementary information
(1) Summary of Consolidated Business Results
(Yen in millions, except for %) Ordinary income and expenses % 1,809,983 1,945,005 135,022 7.5 Net premiums written 1,517,665 1,735,122 217,456 14.3 62,813 64,683 1,869 3.0 Life insurance premiums 201,096 116,961 (84,134) (41.8) 1,641,979 1,696,436 54,457 3.3 Net claims paid 795,850 793,246 (2,603) (0.3) Loss adjustment expenses 59,193 63,840 4,646 7.9 Agency commissions and brokerage 302,721 337,163 34,442 11.4 Maturity refunds to policyholders 96,984 95,133 (1,851) (1.9) Life insurance claims 144,116 178,115 33,998 23.6 Provision for outstanding claims 18,114 143,584 125,470 692.7 Provision for underwriting reserves 222,002 79,270 (142,732) (64.3) 316,445 244,231 (72,214) (22.8) Interest and dividends 165,283 197,448 32,165 19.5 Gains on sales of securities 48,009 55,574 7,564 15.8 27,850 72,798 44,947 161.4 Losses on sales of securities 5,143 6,716 1,573 30.6 Impairment losses on securities 2,130 4,233 2,103 98.8 311,224 349,816 38,592 12.4 39,837 45,991 6,153 15.4 Equity in earnings (losses) of affiliates 315 716 401 127.0 185,211 116,176 (69,035) (37.3) Extraordinary gains and losses 1,710 153 (1,557) (91.1) 13,093 3,841 (9,251) (70.7) (11,382) (3,688) 7,693
112,487 (61,342) (35.3) 38,355 45,885 7,529 19.6 (8,199) (20,036) (11,836)
25,848 (4,307) (14.3) 143,672 86,638 (57,034) (39.7) 729 1,033 304 41.7 142,943 85,605 (57,338) (40.1) Rate of change Other ordinary income and expenses Six months ended September 30, 2014 (April 1, 2014 to September 30, 2014) Six months ended September 30, 2015 (April 1, 2015 to September 30, 2015) Increase (Decrease) Underwriting expenses Investment income Net income attributable to owners of the parent Ordinary profit Extraordinary losses Extraordinary gains (losses) Net income attributable to non-controlling interests Net income Income taxes - current Total income taxes Income before income taxes and non-controlling interests Extraordinary gains Deposit premiums from policyholders Income taxes - deferred Underwriting income Investment expenses Operating and general administrative expenses
Tokio Marine Holdings, Inc. 11
SLIDE 14
Direct premiums written including deposit premiums from policyholders
(Yen in millions, except for %)
Amount Amount
Fire and allied lines 274,329 17.1 8.1 330,039 18.6 20.3 Hull and cargo 63,897 4.0 5.2 63,441 3.6 (0.7) Personal accident 176,563 11.0 10.8 181,210 10.2 2.6 Voluntary automobile 624,232 38.9 7.2 664,900 37.5 6.5 Compulsory automobile liability 140,352 8.7 (0.3) 148,091 8.4 5.5 Others 326,003 20.3 9.7 384,363 21.7 17.9 Total 1,605,379 100.0 7.5 1,772,047 100.0 10.4
Deposit premiums from policyholders
62,813 3.9 13.6 64,683 3.7 3.0
Net premiums written
(Yen in millions, except for %)
Amount Amount
Fire and allied lines 245,368 16.2 4.1 341,579 19.7 39.2 Hull and cargo 56,932 3.8 5.1 61,012 3.5 7.2 Personal accident 113,568 7.5 5.2 116,324 6.7 2.4 Voluntary automobile 642,896 42.4 8.7 694,774 40.0 8.1 Compulsory automobile liability 149,641 9.9 5.4 155,838 9.0 4.1 Others 309,258 20.4 8.9 365,592 21.1 18.2 Total 1,517,665 100.0 7.2 1,735,122 100.0 14.3
Net claims paid
(Yen in millions, except for %)
Amount Amount
Fire and allied lines 150,575 18.9 36.5 116,016 14.6 (23.0) Hull and cargo 25,231 3.2 (11.8) 28,576 3.6 13.3 Personal accident 47,709 6.0 0.7 47,660 6.0 (0.1) Voluntary automobile 345,543 43.4 3.9 356,647 45.0 3.2 Compulsory automobile liability 116,071 14.6 (0.6) 114,468 14.4 (1.4) Others 110,717 13.9 0.6 129,877 16.4 17.3 Total 795,850 100.0 6.7 793,246 100.0 (0.3) Six months ended September 30, 2014 (April 1, 2014 to September 30, 2014) Six months ended September 30, 2015 (April 1, 2015 to September 30, 2015)
Composition ratio Rate of change Composition ratio Rate of change %_ %_
Six months ended September 30, 2014 (April 1, 2014 to September 30, 2014) Six months ended September 30, 2015 (April 1, 2015 to September 30, 2015)
Composition ratio Rate of change Composition ratio Rate of change
(2) Premiums written and claims paid by lines of business
Six months ended September 30, 2014 (April 1, 2014 to September 30, 2014) Six months ended September 30, 2015 (April 1, 2015 to September 30, 2015)
Composition ratio Rate of change Composition ratio Rate of change %_ %_ %_ %_ %_ %_ %_ %_ %_ %_
Tokio Marine Holdings, Inc. 12
SLIDE 15 (3) Securities
- 1. Bonds held to maturity
(Yen in millions) Fair value Difference Fair value Difference
Domestic debt securities
3,256,138 3,698,936 442,797 3,265,640 3,697,144 431,503
Foreign securities
15,970 16,300 329 26,214 26,826 611
Subtotal
3,272,109 3,715,236 443,127 3,291,855 3,723,970 432,114
Domestic debt securities
2,048 2,029 (19) 2,047 2,043 (4)
Foreign securities
11,400 11,155 (245) 2,618 2,497 (121)
Subtotal
13,449 13,184 (265) 4,665 4,540 (125) 3,285,559 3,728,421 442,862 3,296,521 3,728,510 431,989
- 2. Bonds earmarked for underwriting reserves
(Yen in millions) Fair value Difference Fair value Difference
Domestic debt securities
76,476 79,774 3,297 69,209 72,038 2,828
Foreign securities
40,543 42,728 2,184 32,278 33,891 1,612
Subtotal
117,019 122,502 5,482 101,488 105,929 4,441
Subtotal
2,037 2,020 (16) 1,712 1,699 (12) 119,056 124,522 5,465 103,200 107,629 4,429
- 3. Available-for-sale securities
(Yen in millions) Cost Difference Cost Difference
Domestic debt securities
3,666,969 3,384,924 282,044 3,496,947 3,219,876 277,070
Domestic equity securities
2,812,843 700,963 2,111,880 2,492,495 686,400 1,806,095
Foreign securities
2,518,871 2,291,458 227,412 2,440,464 2,247,567 192,896
Others (Note 2)
549,097 506,942 42,155 519,981 482,024 37,957
Subtotal
9,547,781 6,884,288 2,663,493 8,949,888 6,635,869 2,314,019
Domestic debt securities
319,857 321,536 (1,679) 184,250 185,708 (1,458)
Domestic equity securities
11,381 12,221 (840) 12,669 14,011 (1,342)
Foreign securities
711,722 740,860 (29,137) 1,212,517 1,259,524 (47,007)
Others (Note 3)
849,532 855,405 (5,872) 1,002,011 1,014,560 (12,548)
Subtotal
1,892,494 1,930,024 (37,529) 2,411,449 2,473,805 (62,356) 11,440,275 8,814,312 2,625,963 11,361,337 9,109,674 2,251,662 Carrying amount shown on balance sheet Carrying amount shown on balance sheet Carrying amount shown on balance sheet Carrying amount shown on balance sheet As of September 30, 2015 Those with fair value exceeding the cost Those with fair value not exceeding the cost Those with fair value exceeding the carrying amount Those with fair value not exceeding the carrying amount As of March 31, 2015 Total Fair value shown on balance sheet Fair value shown on balance sheet Total As of March 31, 2015 As of September 30, 2015 Those with fair value exceeding the carrying amount Those with fair value not exceeding the carrying amount As of March 31, 2015 As of September 30, 2015 Total
Foreign securities
2,037 2,020 (16) 1,712 1,699 (12)
Tokio Marine Holdings, Inc. 13
SLIDE 16 (Note) 1. 2. 3.
For the fiscal year ended March 31, 2015, impairment losses of 4,416 million yen (domestic equity securities: 10 million yen; foreign securities: 3,210 million yen; others: 1,195 million yen) were recognized for "Available-for-sale securities" with fair value. Impairment losses of 1,391 million yen (domestic equity securities: 828 million yen; foreign securities: 515 million yen; others: 47 million yen) were also recognized for those whose fair value cannot be measured reliably. For the six months ended September 30, 2015, impairment losses of 5,740 million yen (domestic equity securities: 531 million yen; foreign securities: 3,447 million yen; others: 1,761 million yen) were recognized for "Available-for-sale securities" with fair
- value. Impairment losses of 254 million yen (domestic equity securities: 49 million yen; foreign securities: 205 million yen) were
also recognized for those whose fair value cannot be measured reliably. In principle, an impairment loss on a security with fair value is recognized when the fair value is 30% or more below its cost.
Available-for-sale securities whose fair value can not be measured reliably are not included in the table above. As of March 31, 2015, "Others" includes negotiable certificates of deposit (fair value: 188 million yen; cost: 186 million yen; difference: 2 million yen) which are presented as "Cash and bank deposits" on the consolidated balance sheet, and foreign mortgage securities, etc. (fair value: 531,002 million yen; cost: 491,841 million yen; difference: 39,161 million yen) which are presented as "Monetary receivables bought"
- n the consolidated balance sheet.
As of September 30, 2015, "Others" includes negotiable certificates of deposit (fair value: 196 million yen; cost: 189 million yen; difference: 7 million yen) which are presented as "Cash and bank deposits" on the consolidated balance sheet, and foreign mortgage securities, etc. (fair value: 511,303 million yen; cost: 475,833 million yen; difference: 35,469 million yen) which are presented as "Monetary receivables bought"
- n the consolidated balance sheet.
As of March 31, 2015, "Others" includes negotiable certificates of deposit (fair value: 21,811 million yen; cost: 21,811 million yen) which are presented as "Cash and bank deposits" on the consolidated balance sheet, and commercial paper, etc. (fair value: 827,719 million yen; cost: 833,591 million yen; difference: (5,871) million yen) which are presented as "Monetary receivables bought" on the consolidated balance sheet. As of September 30, 2015, "Others" includes negotiable certificates of deposit (fair value: 81,016 million yen; cost: 81,016 million yen) which are presented as "Cash and bank deposits" on the consolidated balance sheet, and commercial paper, etc. (fair value: 895,241 million yen; cost: 904,786 million yen; difference: (9,544) million yen) which are presented as "Monetary receivables bought" on the consolidated balance sheet.
Tokio Marine Holdings, Inc. 14
SLIDE 17 (Yen in millions) Principal amount Fair value Unrealized gains (losses) Principal amount Fair value Unrealized gains (losses)
Foreign currency-related instruments Currency futures Short 8,826
- 8,199
- Long
- 4,253
- Foreign exchange forwards
Short 352,119 (1,747) (1,747) 581,861 5,754 5,754 Long 36,643 (279) (279) 47,612 (378) (378) Currency swaps 211,065 (462) (462) 182,483 (1,097) (1,097) Currency options Short 62,884 65,177 [7,296] 11,493 (4,196) [5,960] 7,633 (1,673) Long 34,751 36,701 [4,177] 8,527 4,350 [3,642] 6,433 2,791 Interest rate-related instruments Interest rate futures Short 115,637
7,764
- 437
- Interest rate options
Short 29,407 14,717 [314] 313 [218] 217 Interest rate swaps 3,725,130 6,491 6,491 3,220,453 20,279 20,279 Equity-related instruments Equity index futures Short 25,175 (66) (66) 55,806 335 335 Equity index options Short 58,306 65,837 [1,667] 3,378 (1,710) [2,025] 1,610 415 Long 78,485 85,066 [9,071] 6,816 (2,254) [9,562] 5,132 (4,430) Bond-related instruments Bond futures Short 141,894 (1,060) (1,060) 206,487 (1,969) (1,969) Bond future options Short 14,600
21 (9) [-]
14,700
44 19 [-]
- Bond over-the-counter options
Short 34,775 20,988 [214] 108 105 [90] 77 13 Long 34,775 20,988 [261] 431 170 [116] 120 3 Credit-related instruments Credit derivatives Sell protection 18,412 (807) (807) 16,812 (401) (401) Commodity-related instruments Commodity swaps 5,922 (224) (224) 5,091 (199) (199) Others Index basket options Long 174,952 132,231 [43,913] (3,802) (47,715) [46,282] (2,427) (48,710) Natural catastrophe derivatives Short 37,598 41,145 [2,651] 1,067 1,583 [3,315] 2,040 1,275 Long 20,219 23,020 [767] 163 (604) [1,519] 928 (591) Weather derivatives Short 13 28 [1] [2] 1 Total 30,094 (48,104) 43,869 (28,368)
(Note)
- 2. Those instruments to which hedge accounting is applied are not included in the table above.
(4) Derivative financial instruments
As of March 31, 2015 As of September 30, 2015
- 1. For option contracts, option premiums are shown with [ ].
Tokio Marine Holdings, Inc. 15