
SLIDE 1
Summary of Consolidated Business Results of Tokio Marine Holdings, Inc. under Japanese GAAP for the six months ended September 30, 2019
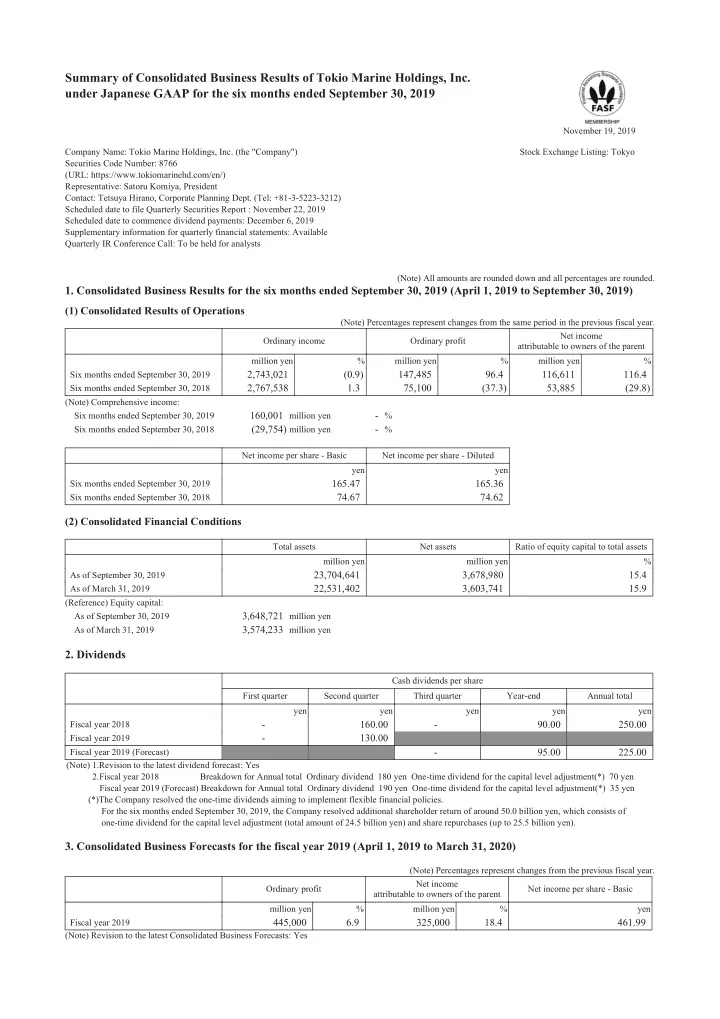
November 19, 2019 Company Name: Tokio Marine Holdings, Inc. (the "Company") Stock Exchange Listing: Tokyo Securities Code Number: 8766 (URL: https://www.tokiomarinehd.com/en/) Representative: Satoru Komiya, President Contact: Tetsuya Hirano, Corporate Planning Dept. (Tel: +81-3-5223-3212) Scheduled date to file Quarterly Securities Report : November 22, 2019 Scheduled date to commence dividend payments: December 6, 2019 Supplementary information for quarterly financial statements: Available Quarterly IR Conference Call: To be held for analysts (Note) All amounts are rounded down and all percentages are rounded.
- 1. Consolidated Business Results for the six months ended September 30, 2019 (April 1, 2019 to September 30, 2019)
(1) Consolidated Results of Operations
(Note) Percentages represent changes from the same period in the previous fiscal year. Ordinary income Ordinary profit Net income attributable to owners of the parent million yen % million yen % million yen % Six months ended September 30, 2019
2,743,021 (0.9) 147,485 96.4 116,611 116.4
Six months ended September 30, 2018
2,767,538 1.3 75,100 (37.3) 53,885 (29.8)
(Note) Comprehensive income: Six months ended September 30, 2019
160,001 million yen
- %
Six months ended September 30, 2018
(29,754) million yen
- %
Net income per share - Basic Net income per share - Diluted yen yen Six months ended September 30, 2019
165.47 165.36
Six months ended September 30, 2018
74.67 74.62
(2) Consolidated Financial Conditions
Total assets Net assets Ratio of equity capital to total assets million yen million yen % As of September 30, 2019
23,704,641 3,678,980 15.4
As of March 31, 2019
22,531,402 3,603,741 15.9
(Reference) Equity capital: As of September 30, 2019
3,648,721 million yen
As of March 31, 2019
3,574,233 million yen
- 2. Dividends
Cash dividends per share First quarter Second quarter Third quarter Year-end Annual total yen yen yen yen yen Fiscal year 2018
- 160.00
- 90.00
250.00
Fiscal year 2019
- 130.00
Fiscal year 2019 (Forecast)
- 95.00
225.00
(Note) 1.Revision to the latest dividend forecast: Yes 2.Fiscal year 2018 Breakdown for Annual total Ordinary dividend 180 yen One-time dividend for the capital level adjustment(*) 70 yen Fiscal year 2019 (Forecast) Breakdown for Annual total Ordinary dividend 190 yen One-time dividend for the capital level adjustment(*) 35 yen (*)The Company resolved the one-time dividends aiming to implement flexible financial policies. For the six months ended September 30, 2019, the Company resolved additional shareholder return of around 50.0 billion yen, which consists of
- ne-time dividend for the capital level adjustment (total amount of 24.5 billion yen) and share repurchases (up to 25.5 billion yen).
- 3. Consolidated Business Forecasts for the fiscal year 2019 (April 1, 2019 to March 31, 2020)