
SLIDE 1
Summary of Consolidated Business Results of Tokio Marine Holdings, Inc. under Japanese GAAP for the year ended March 31, 2014
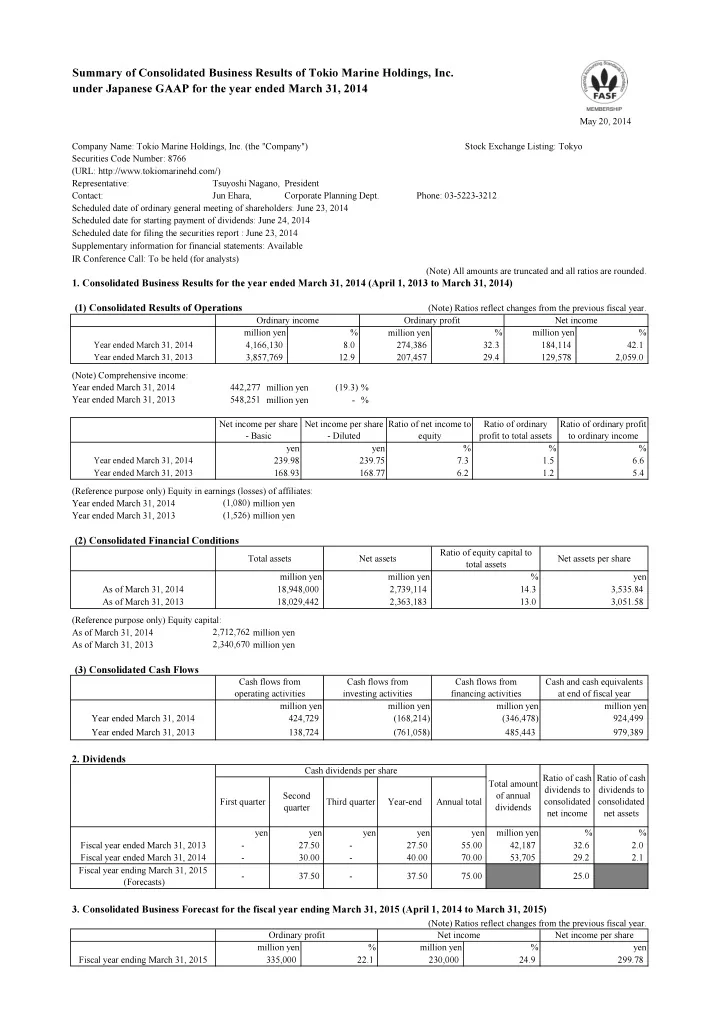
May 20, 2014 Company Name: Tokio Marine Holdings, Inc. (the "Company") Stock Exchange Listing: Tokyo Securities Code Number: 8766 (URL: http://www.tokiomarinehd.com/) Representative: Tsuyoshi Nagano, President Contact: Jun Ehara, Corporate Planning Dept. Phone: 03-5223-3212 Scheduled date of ordinary general meeting of shareholders: June 23, 2014 Scheduled date for starting payment of dividends: June 24, 2014 Scheduled date for filing the securities report : June 23, 2014 Supplementary information for financial statements: Available IR Conference Call: To be held (for analysts) (Note) All amounts are truncated and all ratios are rounded.
- 1. Consolidated Business Results for the year ended March 31, 2014 (April 1, 2013 to March 31, 2014)
(Note) Ratios reflect changes from the previous fiscal year. (Note) Comprehensive income: Year ended March 31, 2014 million yen % Year ended March 31, 2013 million yen
- %
(Reference purpose only) Equity in earnings (losses) of affiliates: Year ended March 31, 2014 million yen Year ended March 31, 2013 million yen
(2) Consolidated Financial Conditions
(Reference purpose only) Equity capital: As of March 31, 2014 million yen As of March 31, 2013 million yen
(3) Consolidated Cash Flows
- 2. Dividends
- 3. Consolidated Business Forecast for the fiscal year ending March 31, 2015 (April 1, 2014 to March 31, 2015)
(Note) Ratios reflect changes from the previous fiscal year. 3,535.84 As of March 31, 2013 18,029,442 2,363,183 13.0 3,051.58 As of March 31, 2014 18,948,000 2,739,114 14.3 Ratio of equity capital to total assets Net assets per share million yen million yen % yen (1,526) Total assets Net assets 5.4 Year ended March 31, 2013 168.93 168.77 6.2 % Year ended March 31, 2014 239.98 239.75 7.3 1.5 6.6 yen 924,499 Year ended March 31, 2013 138,724 (761,058) 485,443 979,389 Year ended March 31, 2014 424,729 million yen Cash flows from
- perating activities
Ratio of ordinary profit to total assets Ratio of ordinary profit to ordinary income yen % Net income per share
- Diluted
Ratio of net income to equity % million yen million yen million yen Fiscal year ending March 31, 2015 (Forecasts)
- 37.50
- 25.0
40.00 70.00 53,705 29.2 2.1 37.50 75.00 32.6 2.0 Fiscal year ended March 31, 2014
- 30.00
- million yen
% % Fiscal year ended March 31, 2013
- 27.50
- 27.50
55.00 42,187 Annual total yen yen yen yen yen Cash dividends per share Total amount
- f annual
dividends Ratio of cash dividends to consolidated net income Ratio of cash dividends to consolidated net assets First quarter Second quarter Third quarter 129,578 2,059.0 42.1 184,114 million yen % Net income million yen Net income per share Net income Ordinary profit yen % million yen 299.78 % 24.9 230,000 22.1 Year-end Cash flows from investing activities Cash flows from financing activities 2,712,762 (168,214) (346,478) Cash and cash equivalents at end of fiscal year Net income per share
- Basic