SLIDE 1 Summary of Consolidated Business Results of Tokio Marine Holdings, Inc. under Japanese GAAP for the fiscal year ended March 31, 2019
May 20, 2019 Company Name: Tokio Marine Holdings, Inc. (the "Company") Stock Exchange Listing: Tokyo Securities Code Number: 8766 (URL: https://www.tokiomarinehd.com/en/) Representative: Tsuyoshi Nagano, President Contact: Tetsuya Hirano, Corporate Planning Dept. (Tel: +81-3-5223-3212) Scheduled date of Ordinary General Meeting of Shareholders: June 24, 2019 Scheduled date to commence dividend payments: June 25, 2019 Scheduled date to file Securities Report: June 21, 2019 Supplementary information for financial statements: Available IR Conference Call: To be held for analysts (Note) All amounts are rounded down and all percentages are rounded.
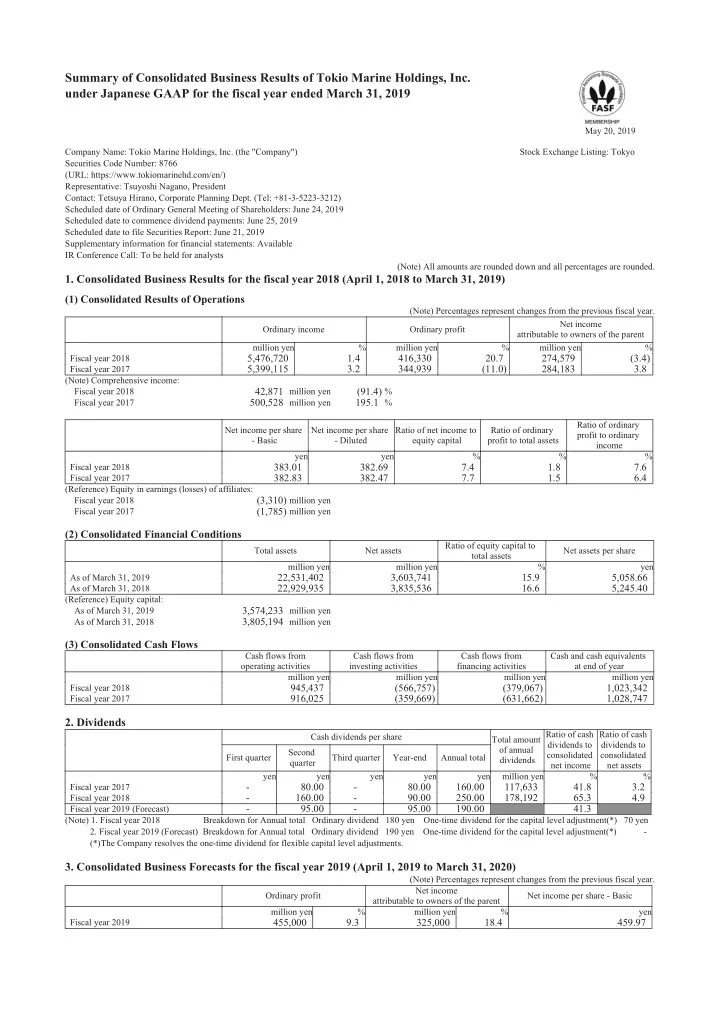
- 1. Consolidated Business Results for the fiscal year 2018 (April 1, 2018 to March 31, 2019)
(1) Consolidated Results of Operations
(Note) Percentages represent changes from the previous fiscal year. Ordinary income Ordinary profit Net income attributable to owners of the parent million yen % million yen % million yen % Fiscal year 2018
5,476,720 1.4 416,330 20.7 274,579 (3.4)
Fiscal year 2017
5,399,115 3.2 344,939 (11.0) 284,183 3.8
(Note) Comprehensive income: Fiscal year 2018
42,871 million yen (91.4) %
Fiscal year 2017
500,528 million yen 195.1 %
Net income per share
Net income per share
Ratio of net income to equity capital Ratio of ordinary profit to total assets Ratio of ordinary profit to ordinary income yen yen % % % Fiscal year 2018
383.01 382.69 7.4 1.8 7.6
Fiscal year 2017
382.83 382.47 7.7 1.5 6.4
(Reference) Equity in earnings (losses) of affiliates: Fiscal year 2018
(3,310) million yen
Fiscal year 2017
(1,785) million yen
(2) Consolidated Financial Conditions
Total assets Net assets Ratio of equity capital to total assets Net assets per share million yen million yen % yen As of March 31, 2019
22,531,402 3,603,741 15.9 5,058.66
As of March 31, 2018
22,929,935 3,835,536 16.6 5,245.40
(Reference) Equity capital: As of March 31, 2019
3,574,233 million yen
As of March 31, 2018
3,805,194 million yen
(3) Consolidated Cash Flows
Cash flows from
Cash flows from investing activities Cash flows from financing activities Cash and cash equivalents at end of year million yen million yen million yen million yen Fiscal year 2018
945,437 (566,757) (379,067) 1,023,342
Fiscal year 2017
916,025 (359,669) (631,662) 1,028,747
Cash dividends per share Total amount
dividends Ratio of cash dividends to consolidated net income Ratio of cash dividends to consolidated net assets First quarter Second quarter Third quarter Year-end Annual total yen yen yen yen yen million yen % % Fiscal year 2017
160.00 117,633 41.8 3.2
Fiscal year 2018
250.00 178,192 65.3 4.9
Fiscal year 2019 (Forecast)
190.00 41.3
(Note) 1. Fiscal year 2018 Breakdown for Annual total Ordinary dividend 180 yen One-time dividend for the capital level adjustment(*) 70 yen
- 2. Fiscal year 2019 (Forecast) Breakdown for Annual total Ordinary dividend 190 yen One-time dividend for the capital level adjustment(*) -
(*)The Company resolves the one-time dividend for flexible capital level adjustments.
- 3. Consolidated Business Forecasts for the fiscal year 2019 (April 1, 2019 to March 31, 2020)
(Note) Percentages represent changes from the previous fiscal year. Ordinary profit Net income attributable to owners of the parent Net income per share - Basic million yen % million yen % yen Fiscal year 2019
455,000 9.3 325,000 18.4 459.97
SLIDE 2 * Notes
(1) Changes in significant subsidiaries during the fiscal year 2018 (Changes in specified subsidiaries that resulted in a change in the scope of consolidation): Yes Newly consolidated: None Excluded from consolidation: Tokio Millennium Re AG, Tokio Millennium Re (UK) Limited, HCC Insurance Holdings (International) Limited (Note) Please refer to Appendix p.12 "(6) Changes in significant matters related to consolidated financial statements" for details. (2) Changes in accounting policies, changes in accounting estimates, and retrospective restatements (a) Changes in accounting policies to reflect amendments of accounting standards: None (b) Changes in accounting policies other than (a): None (c) Changes in accounting estimates: None (d) Retrospective restatements: None (3) Number of shares issued (common stock) (a) Total number of shares issued including treasury stock As of March 31, 2019
710,000,000 shares
As of March 31, 2018
748,024,375 shares
(b) Number of treasury stock held As of March 31, 2019
3,443,216 shares
As of March 31, 2018
22,591,149 shares
(c) Average number of shares outstanding During the fiscal year 2018
716,886,595 shares
During the fiscal year 2017
742,316,186 shares
(Reference) Summary of Non-consolidated Business Results of Tokio Marine Holdings, Inc. under Japanese GAAP for the fiscal year ended March 31, 2019
- 1. Non-consolidated Business Results for the fiscal year 2018 (April 1, 2018 to March 31, 2019)
(1) Non-consolidated Results of Operations
(Note) Percentages represent changes from the previous fiscal year. Operating income Operating profit Ordinary profit Net income million yen % million yen % million yen % million yen % Fiscal year 2018
299,837 31.8 282,264 31.1 281,967 30.9 278,374 36.8
Fiscal year 2017
227,510 168.6 215,342 189.2 215,378 189.1 203,486 196.3
Net income per share - Basic Net income per share - Diluted yen yen Fiscal year 2018
388.30 387.98
Fiscal year 2017
274.12 273.86
(2) Non-consolidated Financial Conditions
Total assets Net assets Ratio of equity capital to total assets Net assets per share million yen million yen % yen As of March 31, 2019
2,409,066 2,403,369 99.7 3,398.01
As of March 31, 2018
2,401,883 2,399,182 99.8 3,303.72
(Reference) Equity capital: As of March 31, 2019
2,400,889 million yen
As of March 31, 2018
2,396,629 million yen
- 2. Non-consolidated Business Forecasts for the fiscal year 2019 (April 1, 2019 to March 31, 2020)
(Note) Percentages represent changes from the previous fiscal year. Operating income Ordinary profit Net income Net income per share - Basic million yen % million yen % million yen % yen Fiscal year 2019
156,000 (48.0) 131,000 (53.5) 130,000 (53.3) 183.99
* "Summary of Consolidated Business Results" is outside the scope of external audit. * Notes concerning the business forecasts and other items
Business forecasts are prepared based on certain assumptions and information available to the Company as of the release date of this document, and actual results may significantly differ depending on various factors. For key assumptions for the business forecasts and other related information, please refer to Appendix p. 3.
SLIDE 3 Tokio Marine Holdings, Inc.
Contents of Appendix
- 1. Overview of Business results ………..………………………………………………………………………………………………
2 (1) Consolidated Results of Operations for the fiscal year 2018 ….…………………………………………………………………… 2 (2) Consolidated Financial Conditions as of March 31, 2019 ……..…………………………………………………………………… 2 (3) Consolidated Business Forecasts for the fiscal year 2019 ……..…………………………………………………………………… 3
- 2. Basic Approach to the Selection of Accounting Standards …………………………………………………………………………
3
- 3. Consolidated Financial Statements and Major Notes ………………………………………………………………………………
4 (1) Consolidated Balance Sheet ………………………………………………………………………………………………………… 4 (2) Consolidated Statement of Income and Consolidated Statement of Comprehensive Income ……………………………………… 5 (3) Consolidated Statement of Changes in Shareholders' Equity ……………………………………………………………………… 8 (4) Consolidated Statement of Cash Flows …………………………………………………………………………………………… 10 (5) Notes regarding going concern assumption ………………………………………………………………………………………… 12 (6) Changes in significant matters related to consolidated financial statements……………………………………………………… 12 (7) Changes in presentation…………………………………………………………………………………………………………… 12 (8) Notes to Consolidated Financial Statements ……………………………………………………………………………………… 13 Segment information ……………………………………………………………………………………………………………… 13 Per share information ……………………………………………………………………………………………………………… 14 Business Combinations and Other Matters………………………………………………………………………………………… 14 Subsequent events ………………………………………………………………………………………………………………… 16
- 4. Others ………………………………………………………………………………………………………………………………… 17
(1) Summary of Consolidated Business Results ……………………………………………………………………………………… 17 (2) Premiums written and claims paid by lines of business …………………………………………………………………………… 18 (3) Securities …………………………………………………………………………………………………………………………… 19 (4) Derivative transactions …...………………………………………………………………………………………………………… 21 1
SLIDE 4 Tokio Marine Holdings, Inc.
- 1. Overview of Business results
(1) Consolidated Results of Operations for the fiscal year 2018
During the fiscal year 2018, the world economy as a whole progressed gradually due to the economic expansion in the U.S. In contrast, concerns about an economic downturn escalated towards the end of the fiscal year as the economy in Europe and China slowed down, reflecting the intensifying trade friction between the U.S. and China and the increasing uncertainty over the withdrawal of the UK from the EU. In Japan, economic growth slowed down compared with the previous year due to the impact of natural disasters although the economy gradually improved mainly due to domestic demand such as consumer spending and capital expenditures. Under these circumstances, as a result of our efforts to expand our business, which is centered on non-life insurance and life insurance, our consolidated results of operations for the fiscal year 2018 were as follows: Ordinary income increased by 77.6 billion yen to 5,476.7 billion yen from the previous fiscal year, the main components
- f which were Underwriting income of 4,769.6 billion yen and Investment income of 589.2 billion yen. Ordinary
expenses increased by 6.2 billion yen to 5,060.3 billion yen from the previous fiscal year, the main components of which were Underwriting expenses of 4,079.7 billion yen, Investment expenses of 90.2 billion yen, and Operating and general administrative expenses of 861.3 billion yen. As a result, Ordinary profit increased by 71.3 billion yen to 416.3 billion yen from the previous fiscal year. Net income attributable to owners of the parent, composed of Ordinary profit plus Extraordinary gains minus Extraordinary losses and Total income taxes, decreased by 9.6 billion yen to 274.5 billion yen from the previous fiscal year. Results by our reportable segments are as follows: In the Domestic non-life insurance business, Ordinary income increased by 168.2 billion yen to 2,847.1 billion yen from the previous fiscal year. Ordinary profit composed of Ordinary income minus Ordinary expenses such as Net claims paid decreased by 14.1 billion yen to 228.3 billion yen from the previous fiscal year. In the Domestic life insurance business, Ordinary income decreased by 39.3 billion yen to 779.3 billion yen from the previous fiscal year. Ordinary profit composed of Ordinary income minus Ordinary expenses such as Life insurance claims increased by 16.4 billion yen to 40.2 billion yen from the previous fiscal year. In the Overseas insurance business, Ordinary income increased by 89.0 billion yen to 1,972.0 billion yen from the previous fiscal year. Ordinary profit composed of Ordinary income minus Ordinary expenses such as Net claims paid increased by 70.2 billion yen to 141.6 billion yen from the previous fiscal year.
(2) Consolidated Financial Conditions as of March 31, 2019
As of March 31, 2019, consolidated total assets was 22,531.4 billion yen, a decrease of 398.5 billion yen from that as of March 31, 2018, mainly due to the exclusion of Tokio Millennium Re AG and Tokio Millennium Re (UK) Limited from the scope of consolidation, despite the expansion of our domestic and international insurance businesses. Cash flows for the fiscal year 2018 were as follows: Net cash provided by operating activities increased by 29.4 billion yen to 945.4 billion yen compared to the previous fiscal year, mainly due to an increase in premium income. Net cash used in investing activities decreased by 207.0 billion yen to 566.7 billion yen, mainly due to a decrease in proceeds from collection of loans. Net cash used in financing activities decreased by 252.5 billion yen to 379.0 billion yen, mainly due to the impact of a decrease in cash collateral under securities lending transactions for procurement of funds in the previous fiscal year.
2
SLIDE 5 Tokio Marine Holdings, Inc.
As a result, Cash and cash equivalents at end of year was 1,023.3 billion yen, a decrease of 5.4 billion yen from that as of March 31, 2018.
(3) Consolidated Business Forecasts for the fiscal year 2019
The Company's consolidated business forecasts for the fiscal year 2019 are 455.0 billion yen for Ordinary profit and 325.0 billion yen for Net income attributable to owners of the parent. The forecasts are based on the following assumptions:
- Net premiums written and Life insurance premiums are projected to be 3,560.0 billion yen and 1,030.0 billion yen
respectively, based on the Company's own projections taking the business results for previous years into consideration.
- Net incurred losses related to natural catastrophe are projected to be 50.0 billion yen for Tokio Marine & Nichido
Fire Insurance Co., Ltd. and 2.5 billion yen for Nisshin Fire & Marine Insurance Co., Ltd., taking the actual results for previous years into consideration.
- The Company assumes there will be no significant changes in interest rates, exchange rates and stock market
conditions from those as of March 31, 2019. The above forecasts are prepared based on the aforementioned assumptions and information available to the Company as
- f the release date of this document. The actual results may significantly differ depending on various factors.
- 2. Basic Approach to the Selection of Accounting Standards
To enhance international comparability of the Company's financial information and to unify accounting policies within the Group, the Company is considering adopting International Financial Reporting Standards ("IFRS") while conducting preparatory work. The Company will determine the timing of adoption based on the development of discussions surrounding IFRS17 "Insurance Contracts" and other factors.
3
SLIDE 6 Tokio Marine Holdings, Inc.
- 3. Consolidated Financial Statements and Major Notes
(1) Consolidated Balance Sheet
(Yen in millions) As of March 31, 2018 As of March 31, 2019 Assets Cash and bank deposits
733,832 851,657
Call loans
135,000
- Receivables under resale agreements
4,999 999
Receivables under securities borrowing transactions
30,880 9,084
Monetary receivables bought
1,252,343 1,468,952
Money trusts
214,101 2,156
Securities
16,629,902 16,502,611
Loans
1,011,880 932,167
Tangible fixed assets
289,116 293,257
Land
133,673 134,594
Buildings
119,994 120,865
Construction in progress
672 651
Other tangible fixed assets
34,776 37,145
Intangible fixed assets
798,003 767,598
Software
40,091 39,810
Goodwill
423,538 411,681
Other intangible fixed assets
334,372 316,106
Other assets
1,801,286 1,664,969
Net defined benefit assets
8,019 17,515
Deferred tax assets
30,889 29,511
Customers' liabilities under acceptances and guarantees
2,345 2,230
Allowance for doubtful accounts
(12,667) (11,308)
Total assets
22,929,935 22,531,402
Liabilities Insurance liabilities
16,266,467 16,416,905
Outstanding claims
2,953,611 2,863,815
Underwriting reserves
13,312,855 13,553,090
Corporate bonds
59,766 57,514
Other liabilities
1,927,760 1,692,804
Payables under securities lending transactions
383,853 197,623
Other liabilities
1,543,906 1,495,180
Net defined benefit liabilities
255,588 254,430
Provision for employees' bonus
65,752 61,371
Reserves under special laws
100,511 108,457
Reserve for price fluctuation
100,511 108,457
Deferred tax liabilities
366,835 294,805
Negative goodwill
49,369 39,140
Acceptances and guarantees
2,345 2,230
Total liabilities
19,094,398 18,927,661
Net assets Shareholders' equity Share capital
150,000 150,000
Retained earnings
1,837,908 1,742,188
Treasury stock
(114,446) (18,299)
Total shareholders' equity
1,873,461 1,873,889
Accumulated other comprehensive income Unrealized gains (losses) on available-for-sale securities
1,864,865 1,676,369
Deferred gains (losses) on hedge transactions
10,829 9,472
Foreign currency translation adjustments
76,081 24,892
Remeasurements of defined benefit plans
(20,044) (10,389)
Total accumulated other comprehensive income
1,931,732 1,700,344
Stock acquisition rights
2,552 2,479
Non-controlling interests
27,789 27,027
Total net assets
3,835,536 3,603,741
Total liabilities and net assets
22,929,935 22,531,402
4
SLIDE 7 Tokio Marine Holdings, Inc.
(2) Consolidated Statement of Income and Consolidated Statement of Comprehensive Income
(Consolidated Statement of Income)
(Yen in millions) Fiscal year 2017 (April 1, 2017 to March 31, 2018) Fiscal year 2018 (April 1, 2018 to March 31, 2019) Ordinary income
5,399,115 5,476,720
Underwriting income
4,662,061 4,769,640
Net premiums written
3,564,747 3,587,400
Deposit premiums from policyholders
93,752 80,592
Investment income on deposit premiums
44,573 42,624
Life insurance premiums
953,006 1,053,520
Other underwriting income
5,980 5,503
Investment income
623,948 589,247
Interest and dividends
452,491 492,962
Gains on money trusts
6,892 101
Gains on trading securities
499 6,708
Gains on sales of securities
132,245 121,973
Gains on redemption of securities
1,198 2,011
Investment gains on separate accounts
30,508
44,686 8,114
Transfer of investment income on deposit premiums
(44,573) (42,624)
Other ordinary income
113,105 117,831
Amortization of negative goodwill
10,229 10,229
Other ordinary income
102,876 107,602
Ordinary expenses
5,054,175 5,060,389
Underwriting expenses
4,103,092 4,079,779
Net claims paid
1,916,944 2,109,949
Loss adjustment expenses
135,673 141,980
Agency commissions and brokerage
703,865 707,591
Maturity refunds to policyholders
187,435 164,761
Dividends to policyholders
47 28
Life insurance claims
564,482 492,276
Provision for outstanding claims
242,829 170,883
Provision for underwriting reserves
342,129 287,010
Other underwriting expenses
9,684 5,296
Investment expenses
71,339 90,259
Losses on money trusts
7,168 1,540
Losses on sales of securities
29,562 18,967
Impairment losses on securities
6,067 9,835
Losses on redemption of securities
1,244 1,081
Losses on derivatives
14,605 29,648
Investment losses on separate accounts
Other investment expenses
12,689 25,655
Operating and general administrative expenses
856,940 861,365
Other ordinary expenses
22,803 28,985
Interest expenses
13,418 17,039
Increase in allowance for doubtful accounts
781
198 308
Equity in losses of affiliates
1,785 3,310
Amortization of deferred assets under Article 113 of the Insurance Business Act
3,826 3,826
Other ordinary expenses
2,791 4,500
Ordinary profit
344,939 416,330
5
SLIDE 8 Tokio Marine Holdings, Inc.
(Yen in millions) Fiscal year 2017 (April 1, 2017 to March 31, 2018) Fiscal year 2018 (April 1, 2018 to March 31, 2019) Extraordinary gains
1,936 5,011
Gains on disposal of fixed assets
130 1,352
Gains on step acquisitions
Other extraordinary gains
1,805 766
Extraordinary losses
9,322 35,607
Losses on disposal of fixed assets
2,096 1,908
Impairment losses on fixed assets
259 3,248
Provision for reserves under special laws
6,865 7,945
Provision for reserve for price fluctuation
6,865 7,945
Losses on advanced depreciation of real estates
7
- Losses on sales of investment in subsidiaries and affiliates
- 22,504
Other extraordinary losses
92
- Income before income taxes and non-controlling interests
337,553 385,733
Income taxes - current
118,482 119,450
Income taxes - deferred
(67,265) (9,437)
Total income taxes
51,217 110,013
Net income
286,336 275,720
Net income attributable to non-controlling interests
2,153 1,140
Net income attributable to owners of the parent
284,183 274,579
6
SLIDE 9
Tokio Marine Holdings, Inc.
(Consolidated Statement of Comprehensive Income)
(Yen in millions) Fiscal year 2017 (April 1, 2017 to March 31, 2018) Fiscal year 2018 (April 1, 2018 to March 31, 2019) Net income
286,336 275,720
Other comprehensive income Unrealized gains (losses) on available-for-sale securities
251,302 (188,327)
Deferred gains (losses) on hedge transactions
(269) (1,357)
Foreign currency translation adjustments
(32,998) (49,377)
Remeasurements of defined benefit plans
(2,131) 9,676
Share of other comprehensive income of affiliates accounted for by the equity method
(1,711) (3,464)
Total other comprehensive income
214,191 (232,848)
Total comprehensive income
500,528 42,871
Comprehensive income attributable to: Owners of the parent
496,962 43,133
Non-controlling interests
3,566 (262)
7
SLIDE 10 Tokio Marine Holdings, Inc.
(3) Consolidated Statement of Changes in Shareholders' Equity
Fiscal year 2017 (April 1, 2017 to March 31, 2018)
(Yen in millions) Shareholders' equity Share capital Retained earnings Treasury stock Total shareholders' equity Beginning balance
150,000 1,699,030 (13,658) 1,835,371
Changes during the year Dividends
(113,981) (113,981)
Net income attributable to
284,183 284,183
Purchases of treasury stock
(125,091) (125,091)
Disposal of treasury stock
(210) 642 431
Cancellation of treasury stock
(23,661) 23,661
application of equity method
5,675 5,675
Changes in equity resulted from increase in capital of consolidated subsidiaries
(24) (24)
Changes based on generally accepted accounting standards adopted by
(13,119) (13,119)
Others
16 16
Net changes in items other than shareholders' equity Total changes during the year
(100,787) 38,089
Ending balance
150,000 1,837,908 (114,446) 1,873,461
Accumulated other comprehensive income Stock acquisition rights Non-controlling interests Total net assets Unrealized gains (losses) on available-for-sale securities Deferred gains (losses) on hedge transactions Foreign currency translation adjustments Remeasurements
benefit plans Beginning balance
1,600,740 11,098 112,869 (17,933) 2,292 25,321 3,569,760
Changes during the year Dividends
(113,981)
Net income attributable to
284,183
Purchases of treasury stock
(125,091)
Disposal of treasury stock
431
Cancellation of treasury stock
application of equity method
5,675
Changes in equity resulted from increase in capital of consolidated subsidiaries
(24)
Changes based on generally accepted accounting standards adopted by
(13,119)
Others
16
Net changes in items other than shareholders' equity
264,125 (269) (36,787) (2,110) 260 2,468 227,686
Total changes during the year
264,125 (269) (36,787) (2,110) 260 2,468 265,776
Ending balance
1,864,865 10,829 76,081 (20,044) 2,552 27,789 3,835,536
(Note) "Changes based on generally accepted accounting standards adopted by overseas subsidiaries" for the fiscal year 2017 is the amount reclassified from Unrealized gains (losses) on available-for-sale securities to Retained earnings as a result of the early adoption of ASU 2018-02.
8
SLIDE 11 Tokio Marine Holdings, Inc. Fiscal year 2018 (April 1, 2018 to March 31, 2019)
(Yen in millions) Shareholders' equity Share capital Retained earnings Treasury stock Total shareholders’ equity Beginning balance
150,000 1,837,908 (114,446) 1,873,461
Changes during the year Dividends
(172,636) (172,636)
Net income attributable to
274,579 274,579
Purchases of treasury stock
(102,318) (102,318)
Disposal of treasury stock
(475) 1,316 841
Cancellation of treasury stock
(197,149) 197,149
application of equity method
- Changes in equity resulted
from increase in capital of consolidated subsidiaries
(9) (9)
Changes based on generally accepted accounting standards adopted by
- verseas subsidiaries
- Others
(28) (28)
Net changes in items other than shareholders' equity Total changes during the year
96,147 427
Ending balance
150,000 1,742,188 (18,299) 1,873,889
Accumulated other comprehensive income Stock acquisition rights Non-controlling interests Total net assets Unrealized gains (losses) on available-for-sale securities Deferred gains (losses) on hedge transactions Foreign currency translation adjustments Remeasurements
benefit plans Beginning balance
1,864,865 10,829 76,081 (20,044) 2,552 27,789 3,835,536
Changes during the year Dividends
(172,636)
Net income attributable to
274,579
Purchases of treasury stock
(102,318)
Disposal of treasury stock
841
Cancellation of treasury stock
application of equity method
- Changes in equity resulted
from increase in capital of consolidated subsidiaries
(9)
Changes based on generally accepted accounting standards adopted by
- verseas subsidiaries
- Others
(28)
Net changes in items other than shareholders' equity
(188,495) (1,357) (51,189) 9,654 (72) (762) (232,222)
Total changes during the year
(188,495) (1,357) (51,189) 9,654 (72) (762) (231,795)
Ending balance
1,676,369 9,472 24,892 (10,389) 2,479 27,027 3,603,741
9
SLIDE 12 Tokio Marine Holdings, Inc.
(4) Consolidated Statement of Cash Flows
(Yen in millions) Fiscal year 2017 (April 1, 2017 to March 31, 2018) Fiscal year 2018 (April 1, 2018 to March 31, 2019) Cash flows from operating activities Income before income taxes and non-controlling interests
337,553 385,733
Depreciation
63,765 59,732
Impairment losses on fixed assets
259 3,248
Amortization of goodwill
56,292 49,620
Amortization of negative goodwill
(10,229) (10,229)
Increase (decrease) in outstanding claims
238,672 169,892
Increase (decrease) in underwriting reserves
490,899 449,262
Increase (decrease) in allowance for doubtful accounts
48 (783)
Increase (decrease) in net defined benefit liabilities
7,909 10,432
Increase (decrease) in provision for retirement benefits for directors
(24)
- Increase (decrease) in provision for employees' bonus
786 (942)
Increase (decrease) in reserve for price fluctuation
6,865 7,945
Interest and dividends
(452,491) (492,962)
Losses (gains) on securities
(98,661) (83,807)
Interest expenses
13,418 17,039
Foreign exchange losses (gains)
(23,930) 9,721
Losses (gains) on tangible fixed assets
1,364 555
Equity in losses (earnings) of affiliates
1,785 3,310
Investment losses (gains) on separate accounts
(30,508) 3,530
Decrease (increase) in other assets (other than investing and financing activities)
(73,433) (77,912)
Increase (decrease) in other liabilities (other than investing and financing activities)
17,791 74,269
Others
1,226 4,364
Subtotal
549,363 582,023
Interest and dividends received
453,384 484,471
Interest paid
(14,632) (17,708)
Income taxes paid
(160,107) (126,421)
Others
88,016 23,072
Net cash provided by (used in) operating activities (a)
916,025 945,437
10
SLIDE 13 Tokio Marine Holdings, Inc.
(Yen in millions) Fiscal year 2017 (April 1, 2017 to March 31, 2018) Fiscal year 2018 (April 1, 2018 to March 31, 2019) Cash flows from investing activities Net decrease (increase) in deposits
55,761 20,584
Purchases of monetary receivables bought
(524,539) (909,156)
Proceeds from sales and redemption of monetary receivables bought
534,425 587,522
Purchases of money trusts
(116,995) (7,980)
Proceeds from sales of money trusts
2,322 16,518
Purchases of securities
(2,633,686) (2,542,065)
Proceeds from sales and redemption of securities
2,468,380 2,352,648
Payments for issuance of loans
(836,130) (550,340)
Proceeds from collection of loans
1,067,429 605,285
Changes in cash collateral under securities borrowing and lending transactions
(330,327) (65,653)
Others
(9,768) (9,840)
Subtotal (b)
(323,127) (502,475)
(a) + (b)
592,898 442,962
Purchases of tangible fixed assets
(15,376) (23,910)
Proceeds from sales of tangible fixed assets
995 2,649
Payments for acquisition of businesses
(21,131)
- Purchases of shares of subsidiaries resulting in change in the
scope of consolidation
(1,029) (56,325)
Sales of shares of subsidiaries resulting in change in the scope of consolidation
Net cash provided by (used in) investing activities
(359,669) (566,757)
Cash flows from financing activities Proceeds from borrowings
10,735 20,535
Repayments of borrowings
(147,921) (23,279)
Proceeds from issuance of short-term corporate bonds
Redemption of short-term corporate bonds
Redemption of corporate bonds
(7,111) (792)
Change in cash collateral under securities lending transactions
(246,224) (98,780)
Purchases of treasury stock
(125,091) (102,318)
Dividends paid
(113,855) (172,397)
Dividends paid to non-controlling shareholders
(929) (484)
Repayments to non-controlling shareholders
(72) (206)
Purchases of shares of subsidiaries not resulting in change in the scope of consolidation
(0)
(1,190) (1,341)
Net cash provided by (used in) financing activities
(631,662) (379,067)
Effect of exchange rate changes on cash and cash equivalents
(4,853) (5,017)
Net increase (decrease) in cash and cash equivalents
(80,160) (5,404)
Cash and cash equivalents at beginning of year
1,108,907 1,028,747
Cash and cash equivalents at end of year
1,028,747 1,023,342
11
SLIDE 14
Tokio Marine Holdings, Inc.
(5) Notes regarding going concern assumption
Not applicable.
(6) Changes in significant matters related to consolidated financial statements
(Changes in significant subsidiaries during the fiscal year 2018) Tokio Millennium Re AG and Tokio Millennium Re (UK) Limited were excluded from the scope of consolidation due to the sale of the Company's interest. HCC Insurance Holdings (International) Limited was also excluded due to liquidation.
(7) Changes in presentation
The company has made a change in presentation to the consolidated financial statements since the fiscal year 2018 due to changes in actuarial processes and structures in its overseas subsidiaries during the fiscal year 2017 and 2018, which enabled to achieve improved categorization of their actuarial reserves. As a result, JPY 19,738 million of "Outstanding claims" as of March 31, 2018, and JPY 19,481 million of "Outstanding claims" as of March 31, 2019 are reclassified to "Underwriting reserves".
12
SLIDE 15 Tokio Marine Holdings, Inc.
(8) Notes to Consolidated Financial Statements
(Segment information)
Fiscal year 2017 (April 1, 2017 to March 31, 2018)
(Yen in millions) Reportable segments Adjustments (Note 1) Amounts shown
consolidated financial statements (Note 2) Domestic non-life insurance Domestic life insurance Overseas insurance Financial and
Total Ordinary income Ordinary income from external customers
2,669,871 818,483 1,881,013 64,743 5,434,112 (34,996) 5,399,115
Ordinary income from transactions with other
8,949 209 2,008 27,443 38,612 (38,612)
2,678,821 818,693 1,883,022 92,187 5,472,724 (73,608) 5,399,115
Segment profit
242,485 23,835 71,360 7,257 344,939
Segment assets
8,106,405 7,213,975 7,655,369 73,361 23,049,112 (119,176) 22,929,935
Other items Depreciation
10,969 335 51,292 1,169 63,765
Amortization of goodwill
96
366 56,292
Amortization of negative goodwill
8,917 248 917 145 10,229
Interest and dividends
121,694 97,260 234,807 176 453,938 (1,446) 452,491
Interest expenses
6,049 1,370 6,263 1 13,685 (266) 13,418
Equity in earnings (losses) of affiliates
Investments in affiliates accounted for by the equity method
Increase in tangible and intangible fixed assets
13,087 171 26,172 435 39,867
(Note) 1. "Adjustments" are as follows: (1) "Adjustments" for Ordinary income from external customers of (34,996) million yen includes the transfer of Gains on derivatives of 20,654 million yen. This is included in Ordinary income of Domestic non-life insurance segment and Overseas insurance segment, while it is included in Losses on derivatives in the consolidated statement of income. (2) "Adjustments" for Segment assets of (119,176) million yen is the elimination of transactions with other operating segments. (3) "Adjustments" for Other items is the elimination of transactions with other operating segments.
- 2. Segment profit corresponds to Ordinary profit in the consolidated statement of income.
Fiscal year 2018 (April 1, 2018 to March 31, 2019)
(Yen in millions) Reportable segments Adjustments (Note 1) Amounts shown
consolidated financial statements (Note 2) Domestic non-life insurance Domestic life insurance Overseas insurance Financial and
Total Ordinary income Ordinary income from external customers
2,838,214 779,292 1,970,210 64,839 5,652,557 (175,837) 5,476,720
Ordinary income from transactions with other
8,903 86 1,839 27,316 38,145 (38,145)
2,847,118 779,378 1,972,049 92,156 5,690,703 (213,983) 5,476,720
Segment profit
228,364 40,270 141,604 6,069 416,308 22 416,330
Segment assets
7,837,423 7,385,957 7,280,533 71,736 22,575,650 (44,248) 22,531,402
Other items Depreciation
11,052 311 47,189 1,178 59,732
Amortization of goodwill
96
368 49,620
Amortization of negative goodwill
8,917 248 917 145 10,229
Interest and dividends
133,133 101,421 259,740 79 494,374 (1,412) 492,962
Interest expenses
8,563 1,185 7,494 17,243 (203) 17,039
Equity in earnings (losses) of affiliates
Investments in affiliates accounted for by the equity method
Increase in tangible and intangible fixed assets
18,337 273 16,330 1,654 36,595
(Note) 1. "Adjustments" are as follows: (1) "Adjustments" for Ordinary income from external customers of (175,837) million yen includes the transfer of Reversal of underwriting reserves of 170,995 million yen. This is included in Ordinary income of Domestic non-life insurance segment, while it is included in Provision for underwriting reserves in the consolidated statement of income. (2) "Adjustments" for Segment profit of 22 million yen is the elimination of transactions with other operating segments. (3) "Adjustments" for Segment assets of (44,248) million yen is the elimination of transactions with other operating segments. (4) "Adjustments" for Other items is the elimination of transactions with other operating segments.
- 2. Segment profit corresponds to Ordinary profit in the consolidated statement of income.
13
SLIDE 16 Tokio Marine Holdings, Inc.
(Per share information)
(Yen) Fiscal year 2017 (April 1, 2017 to March 31, 2018) Fiscal year 2018 (April 1, 2018 to March 31, 2019) Net assets per share
5,245.40 5,058.66
Net income per share - Basic
382.83 383.01
Net income per share - Diluted
382.47 382.69
(Note) Calculations of "Net income per share - Basic" and "Net income per share - Diluted" are based on the following figures. Fiscal year 2017 (April 1, 2017 to March 31, 2018) Fiscal year 2018 (April 1, 2018 to March 31, 2019) Net income per share - Basic Net income attributable to owners of parent (Yen in millions)
284,183 274,579
Amount not attributable to common shareholders (Yen in millions)
- Net income attributable to owners of parent
related to common stock (Yen in millions)
284,183 274,579
Average number of shares outstanding (In thousand shares)
742,316 716,886
Net income per share - Diluted Adjustment of net income attributable to owners of parent (Yen in millions)
- Increased number of common stock (In thousand shares)
691 601
Increased number of stock acquisition rights (In thousand shares)
691 601
(Business Combinations and Other Matters)
- 1. Business combination by acquisition
The Company acquired 98.6% of the outstanding shares of Safety Insurance Public Company Limited ("Safety"), a non-life insurance company in Thailand (hereinafter referred to as "the Acquisition") through the Company’s wholly
- wned subsidiary, Tokio Marine & Nichido Fire Insurance Co., Ltd. ("TMNF").
(1) Outline of the business combination
Safety Insurance Public Company Limited
Non-life insurance company
- c. Objective of the business combination
Through the Acquisition, Tokio Marine Group (the "Group") will become the third largest non-life insurance group in Thailand, which is the largest insurance market in Southeast Asia. The non-life insurance market in Thailand has high growth potential as a large number of Japanese companies enter into business in this country. The Group aims to expand its international insurance business in emerging countries by expanding its business in Thailand.
- d. Date of the business combination
August 31, 2018
- e. Form of the business combination
Share purchase of which the consideration is cash
- f. Company name after the business combination
Safety Insurance Public Company Limited
- g. Voting rights acquired through the business combination
98.6%
- h. Primary reasons for determination of controlling company
TMNF is the controlling company, as TMNF acquired 98.6% of voting rights of Safety.
14
SLIDE 17 Tokio Marine Holdings, Inc.
(2) Period for which the acquiree’s operating results are included in the consolidated statement of income of the Company The fiscal year end of the acquiree is December 31, which is different from that of the Company. The Company uses the financial statements as of the acquiree’s latest fiscal year end for consolidation purposes since the intervening period does not exceed three months from the Company’s fiscal year end. As the acquisition date is deemed to be September 30, 2018, the acquiree’s operating results from October 1 to December 31, 2018 are included in the consolidated statement of income for the fiscal year 2018. (3) Acquisition cost and breakdown by class of consideration Consideration for Safety’s shares acquired Cash 42,747 million yen Acquisition costs 42,747 million yen (4) Description and amount of major acquisition-related cost Advisory fee and others 429 million yen (5) Amount, reason for recognition, period and method of amortization of goodwill
24,088 million yen
- b. Reason for recognition of goodwill
The acquisition cost of the acquiree, which was calculated by taking into account projections of the acquiree’s future revenue as of the valuation date, exceeded the net amount of assets acquired and liabilities assumed, and the difference is recognized as goodwill.
- c. Period and method of amortization of goodwill
10 years using the straight line method (6) Amount of assets acquired and liabilities assumed on the date of the business combination and its main components Total assets: 43,552 million yen Cash and bank deposits 9,529 million yen Investment securities 14,714 million yen Total liabilities: 23,863 million yen Insurance liabilities 16,313 million yen (7) Approximate impact on the consolidated statement of income and its calculation methods, assuming that the business combination took place on the first day of the fiscal year 2018 Ordinary income 14,918 million yen Ordinary profit (3,355) million yen Net income attributable to owners of the parent (2,983) million yen (Calculation methods for approximate impact) These amounts of approximate impact represent the difference between the hypothetical amounts of ordinary income, ordinary profit and net income attributable to owners of the parent calculated assuming that the business combination was completed at the beginning of the fiscal year 2018, and their corresponding amounts on consolidated statement of income of the Company for the fiscal year 2018. The amortized amount of goodwill is included in the calculation by assuming that the entire goodwill arising from the business combination was recognized at the beginning of the fiscal year 2018. These amounts of the approximate impact and its calculation methods have been unaudited.
The company sold 100% of the shares of Tokio Millennium Re AG ("TMR") and Tokio Millennium Re (UK) Limited ("TMR(UK)"), owned by TMNF, to RenaissanceRe Holdings Ltd., a reinsurance company in Bermuda. (1) Outline of the business divestiture
- a. Name of the recipient of the divested business
RenaissanceRe Holdings Ltd.
Tokio Millennium Re AG, Tokio Millennium Re (UK) Limited and their subsidiaries, dedicated to reinsurance business
- c. Objective of the business divestiture
The Group established TMR in 2000 as a subsidiary to write overseas reinsurance risks. TMR and TMR(UK) have contributed to Group profits and more recently have broadened the classes of business written into non- catastrophe exposed classes of business. However, the global reinsurance market has recently undergone various changes such as continuing soft market environment driven by steady inflow of capital from outside the reinsurance industry, which has been causing impact on the return earned from the business.
15
SLIDE 18 Tokio Marine Holdings, Inc.
From 2007 onwards, through the significant acquisitions of overseas insurance companies, the Group has created a diversified global portfolio focusing primarily on specialty insurance classes of business. As a result of this, the contribution of reinsurance business in profit terms to our international operations has reduced significantly over the decade. Through the divestment of the reinsurance activities of TMR and TMR(UK), the Group's strategic focus will continue to be on primary insurance business in developed countries as well as emerging markets, and the Group will optimize its global portfolio to current market environment and to its overseas insurance business strategy.
- d. Date of the business divestiture
March 22, 2019
- e. Matters related to the outline of the transaction including its legal form
Share transfer of which the consideration is cash and shares of the recipient (2) Outline of accounting treatment applied
- a. Amount of profits or losses on transfer
Losses on sales of investment in subsidiaries and affiliates 22,504 million yen
- b. Appropriate carrying amounts of the assets and liabilities associated with the transferred business and its main
components Total assets: 550,726 million yen Investment securities 247,615 million yen Other assets 180,990 million yen Total liabilities: 428,681 million yen Insurance liabilities 326,876 million yen
The difference between the consolidated carrying amount and selling price of TMR, TMR(UK) and their subsidiaries is recognized as Losses on sales of investment in subsidiaries and affiliates in Extraordinary losses. (3) Reportable segment to which the divested business belonged Overseas insurance business (4) Approximate amounts of profits or losses related to the divested business which is included in the consolidated statement of income for fiscal year 2018 Ordinary income 141,709 million yen Ordinary profit 14,409 million yen (Subsequent events) On May 20, 2019 the Company's board of directors resolved repurchases of its own shares, pursuant to Article 156 of the Companies Act which is applicable in accordance with Article 165, paragraph 3 of the Companies Act, as detailed below.
- 1. Reason for the repurchase of shares
The Company intends to repurchase its own shares in order to implement flexible capital policies.
- 2. Class of shares to be repurchased
Common stock of the Company
- 3. Aggregate number of shares to be repurchased
Up to 6,250,000 shares
- 4. Aggregate purchase price of shares
Up to 25 billion yen
- 5. Period in which repurchases may be made
From June 1, 2019 through September 20, 2019
16
SLIDE 19 Tokio Marine Holdings, Inc.
(1) Summary of Consolidated Business Results
(Yen in millions) Fiscal year 2017 ( April 1, 2017 to March 31, 2018 ) Fiscal year 2018 ( April 1, 2018 to March 31, 2019 ) Increase (Decrease) Rate of change Ordinary income and expenses % Underwriting income
4,662,061 4,769,640 107,579 2.3
Net premiums written
3,564,747 3,587,400 22,653 0.6
Deposit premiums from policyholders
93,752 80,592 (13,159) (14.0)
Life insurance premiums
953,006 1,053,520 100,513 10.5
Underwriting expenses
4,103,092 4,079,779 (23,313) (0.6)
Net claims paid
1,916,944 2,109,949 193,005 10.1
Loss adjustment expenses
135,673 141,980 6,307 4.6
Agency commissions and brokerage
703,865 707,591 3,726 0.5
Maturity refunds to policyholders
187,435 164,761 (22,673) (12.1)
Life insurance claims
564,482 492,276 (72,205) (12.8)
Provision for outstanding claims
242,829 170,883 (71,946) (29.6)
Provision for underwriting reserves
342,129 287,010 (55,119) (16.1)
Investment income
623,948 589,247 (34,700) (5.6)
Interest and dividends
452,491 492,962 40,470 8.9
Gains on sales of securities
132,245 121,973 (10,271) (7.8)
Investment gains on separate accounts
30,508
(100.0)
Investment expenses
71,339 90,259 18,920 26.5
Losses on sales of securities
29,562 18,967 (10,595) (35.8)
Impairment losses on securities
6,067 9,835 3,768 62.1
Losses on derivatives
14,605 29,648 15,043 103.0
Investment losses on separate accounts
3,530
- Operating and general administrative expenses
856,940 861,365 4,424 0.5
Other ordinary income and expenses
90,302 88,846 (1,455) (1.6)
Equity in earnings (losses) of affiliates
(1,785) (3,310) (1,525)
344,939 416,330 71,390 20.7
Extraordinary gains and losses Extraordinary gains
1,936 5,011 3,074 158.8
Extraordinary losses
9,322 35,607 26,285 281.9
Extraordinary gains (losses)
(7,385) (30,596) (23,210)
- Income before income taxes and
non-controlling interests
337,553 385,733 48,180 14.3
Income taxes - current
118,482 119,450 967 0.8
Income taxes - deferred
(67,265) (9,437) 57,828
51,217 110,013 58,796 114.8
Net income
286,336 275,720 (10,616) (3.7)
Net income attributable to non-controlling interests
2,153 1,140 (1,012) (47.0)
Net income attributable to owners of the parent
284,183 274,579 (9,604) (3.4)
17
SLIDE 20
Tokio Marine Holdings, Inc.
(2) Premiums written and claims paid by lines of business
Direct premiums written including deposit premiums from policyholders
(Yen in millions) Fiscal year 2017 ( April 1, 2017 to March 31, 2018 ) Fiscal year 2018 ( April 1, 2018 to March 31, 2019 ) Amount Composition ratio Rate of change Amount Composition ratio Rate of change
% % % %
Fire and allied lines
621,921 16.2 1.0 647,080 16.5 4.0
Hull and cargo
122,755 3.2 4.6 119,864 3.1 (2.4)
Personal accident
305,180 7.9 (8.0) 291,138 7.4 (4.6)
Voluntary automobile
1,412,434 36.7 3.0 1,414,645 36.1 0.2
Compulsory automobile liability
281,967 7.3 (6.3) 283,097 7.2 0.4
Others
1,105,984 28.7 6.4 1,161,482 29.7 5.0
Total
3,850,243 100.0 2.0 3,917,308 100.0 1.7
Deposit premiums from policyholders
93,752 2.4 (18.1) 80,592 2.1 (14.0)
(Note) Direct premiums written including Deposit premiums from policyholders = Gross premiums written - (Surrender benefits of direct policies + Other refunds of direct policies including Deposit premiums from policyholders)
Net premiums written
(Yen in millions) Fiscal year 2017 ( April 1, 2017 to March 31, 2018 ) Fiscal year 2018 ( April 1, 2018 to March 31, 2019 ) Amount Composition ratio Rate of change Amount Composition ratio Rate of change
% % % %
Fire and allied lines
526,181 14.8 (0.0) 535,865 14.9 1.8
Hull and cargo
106,641 3.0 7.9 104,376 2.9 (2.1)
Personal accident
213,775 6.0 (2.0) 213,219 5.9 (0.3)
Voluntary automobile
1,457,670 40.9 2.5 1,437,427 40.1 (1.4)
Compulsory automobile liability
301,255 8.5 (0.5) 288,152 8.0 (4.3)
Others
959,222 26.9 5.1 1,008,359 28.1 5.1
Total
3,564,747 100.0 2.4 3,587,400 100.0 0.6
Net claims paid
(Yen in millions) Fiscal year 2017 ( April 1, 2017 to March 31, 2018 ) Fiscal year 2018 ( April 1, 2018 to March 31, 2019 ) Amount Composition ratio Rate of change Amount Composition ratio Rate of change
% % % %
Fire and allied lines
308,781 16.1 18.8 470,973 22.3 52.5
Hull and cargo
59,461 3.1 2.4 61,229 2.9 3.0
Personal accident
102,984 5.4 3.4 101,079 4.8 (1.9)
Voluntary automobile
786,792 41.0 3.3 817,731 38.8 3.9
Compulsory automobile liability
219,566 11.5 (2.7) 215,209 10.2 (2.0)
Others
439,357 22.9 7.2 443,727 21.0 1.0
Total
1,916,944 100.0 5.6 2,109,949 100.0 10.1
18
SLIDE 21 Tokio Marine Holdings, Inc.
(3) Securities
(Yen in millions) As of March 31, 2018 As of March 31, 2019 Unrealized gains (losses) included in income
68,220 51,208
- 2. Bonds held to maturity
(Yen in millions) As of March 31, 2018 As of March 31, 2019 Carrying amount shown on balance sheet Fair value Unrealized gains (losses) Carrying amount shown on balance sheet Fair value Unrealized gains (losses) Those with fair value exceeding the carrying amount Domestic debt securities
3,499,834 4,280,260 780,425 4,092,382 5,013,944 921,561
Foreign securities
16,634 17,050 416 20,973 21,496 522
Subtotal
3,516,468 4,297,310 780,842 4,113,356 5,035,440 922,083
Those with fair value not exceeding the carrying amount Domestic debt securities
1,246,592 1,154,080 (92,511) 541,476 508,118 (33,357)
Foreign securities
22,116 21,519 (597) 19,236 18,882 (353)
Subtotal
1,268,709 1,175,600 (93,108) 560,712 527,000 (33,711)
Total
4,785,178 5,472,911 687,733 4,674,069 5,562,441 888,372
- 3. Bonds earmarked for underwriting reserves
(Yen in millions) As of March 31, 2018 As of March 31, 2019 Carrying amount shown on balance sheet Fair value Unrealized gains (losses) Carrying amount shown on balance sheet Fair value Unrealized gains (losses) Those with fair value exceeding the carrying amount Domestic debt securities
22,619 23,664 1,044 363,588 383,613 20,025
Foreign securities
9,171 9,342 170 8,595 8,768 173
Subtotal
31,791 33,006 1,214 372,183 392,382 20,198
Those with fair value not exceeding the carrying amount Domestic debt securities
6,388 6,220 (168) 4,846 4,768 (78)
Subtotal
6,388 6,220 (168) 4,846 4,768 (78)
Total
38,180 39,227 1,046 377,030 397,151 20,120
- 4. Available-for-sale securities
(Yen in millions) As of March 31, 2018 As of March 31, 2019 Fair value shown on balance sheet Cost Unrealized gains (losses) Fair value shown on balance sheet Cost Unrealized gains (losses) Those with fair value exceeding the cost Domestic debt securities
3,604,581 3,202,528 402,052 3,763,498 3,302,105 461,392
Domestic equity securities
2,626,078 613,425 2,012,652 2,344,866 554,813 1,790,052
Foreign securities
3,075,059 2,861,452 213,606 2,889,655 2,747,548 142,107
Others (Note 2)
665,045 622,904 42,141 322,892 296,171 26,720
Subtotal
9,970,764 7,300,311 2,670,453 9,320,912 6,900,639 2,420,273
Those with fair value not exceeding the cost Domestic debt securities
336,688 342,785 (6,097) 124,160 125,274 (1,114)
Domestic equity securities
12,575 14,700 (2,125) 38,299 43,694 (5,394)
Foreign securities
1,312,266 1,346,835 (34,568) 1,436,148 1,485,964 (49,816)
Others (Note 3)
643,587 655,619 (12,032) 1,169,115 1,202,673 (33,558)
Subtotal
2,305,117 2,359,941 (54,823) 2,767,724 2,857,607 (89,883)
Total
12,275,882 9,660,253 2,615,629 12,088,637 9,758,246 2,330,390
(Note) 1. Available-for-sale securities whose fair value cannot be measured reliably are not included in the table above.
- 2. "Others" includes items as follows:
- Foreign mortgage securities, etc. which are presented as Monetary receivables bought on the consolidated balance sheet
As of March 31, 2018: fair value 652,148 million yen, cost 613,589 million yen, unrealized gains 38,559 million yen As of March 31, 2019: fair value 310,370 million yen, cost 285,081 million yen, unrealized gains 25,289 million yen
- 3. "Others" includes items as follows:
- Negotiable certificates of deposit which are presented as Cash and bank deposits on the consolidated balance sheet
As of March 31, 2018: fair value 36,032 million yen, cost 36,032 million yen As of March 31, 2019: fair value 5,424 million yen, cost 5,424 million yen
- Foreign mortgage securities, etc. which are presented as Monetary receivables bought on the consolidated balance sheet
As of March 31, 2018: fair value 598,527 million yen, cost 610,352 million yen, unrealized losses (11,824) million yen As of March 31, 2019: fair value 1,157,090 million yen, cost 1,190,231 million yen, unrealized losses (33,141) million yen
19
SLIDE 22 Tokio Marine Holdings, Inc.
- 5. Bonds held to maturity that were sold
None.
- 6. Bonds earmarked for underwriting reserves that were sold
(Yen in millions) Fiscal year 2017 (April 1, 2017 to March 31, 2018) Fiscal year 2018 (April 1, 2018 to March 31, 2019) Sale proceeds Gains on sale Losses on sale Sale proceeds Gains on sale Losses on sale Domestic debt securities
3,070 74
103
1,504 231 1,116 144
Total
4,574 306 3,395 247
- 7. Available-for-sale securities that were sold
(Yen in millions) Fiscal year 2017 (April 1, 2017 to March 31, 2018) Fiscal year 2018 (April 1, 2018 to March 31, 2019) Sale proceeds Gains on sale Losses on sale Sale proceeds Gains on sale Losses on sale Domestic debt securities
281,603 11,395 8,649 276,180 2,526 1,214
Domestic equity securities
117,953 89,291 603 108,453 82,662 250
Foreign securities
1,046,617 31,239 20,308 1,042,227 35,438 17,502
Others
168,664 7,341 1,916 195,974 5,956 2,384
Total
1,614,838 139,268 31,478 1,622,835 126,584 21,351
(Note) "Others" includes items as follows:
- Negotiable certificates of deposit which are presented as Cash and bank deposits on the consolidated balance sheet
Fiscal year 2017: proceeds 24,270 million yen, gains 91 million yen Fiscal year 2018: proceeds 3,809 million yen
- Foreign mortgage securities, etc. which are presented as Monetary receivables bought on the consolidated balance sheet
Fiscal year 2017: proceeds 144,380 million yen, gains 7,237 million yen, losses 1,916 million yen Fiscal year 2018: proceeds 190,113 million yen, gains 4,858 million yen, losses 2,384 million yen
- 8. Securities on which impairment losses were recognized
Impairment losses were recognized as follows:
- Available-for-sale securities with fair value
Fiscal year 2017: 7,121 million yen (Domestic equity securities 296 million yen, Foreign securities 4,321 million yen, Others 2,502 million yen) Fiscal year 2018: 11,018 million yen (Domestic equity securities 4,322 million yen, Foreign securities 5,294 million yen, Others 1,401 million yen)
- Available-for-sale securities whose fair value cannot be measured reliably
Fiscal year 2017: 439 million yen (Domestic equity securities 206 million yen, Foreign securities 232 million yen) Fiscal year 2018: 218 million yen (Domestic equity securities 108 million yen, Foreign securities 110 million yen) In principle, impairment loss on a security with fair value is recognized when the fair value is below its cost by 30% or more. 20
SLIDE 23 Tokio Marine Holdings, Inc.
(4) Derivative transactions
(Yen in millions) As of March 31, 2018 As of March 31, 2019 Principal amount Fair value Unrealized gains (losses) Principal amount Fair value Unrealized gains (losses) Foreign currency-related instruments Currency futures Short
1,960
659
- 122
- Foreign exchange forwards
Short
662,431 2,227 2,227 477,431 3,784 3,784
Long
137,817 (1,782) (1,782) 70,970 (366) (366)
Currency swaps
12,045
45 45
Interest rate-related instruments Interest rate futures Short
183,507 133 133 272,780 (705) (705)
Long
574
- 2,061
- Interest rate swaps
2,944,185 21,642 21,642 2,688,441 14,776 14,776
Equity-related instruments Equity index futures Short
12,294 (180) (180) 14,337 (103) (103)
Long
2,704 (11) (11) 1,355 (1) (1)
Equity forwards Short
392 38 38
Short
117,884 145,488 [3,084] 8,343 (5,259) [5,102] 929 4,172
Long
158,032 213,915 [10,677] 16,078 5,401 [15,522] 3,171 (12,351)
Bond-related instruments Bond futures Short
24,119 60 60 136,101 (1,855) (1,855)
Long
122,590 1,237 1,237 38,180 292 292
Bond future options Short
11
1 [-]
- Bond over-the-counter options
Short
20,950 91,664 [14] 13 [310] 403 (93)
Long
20,950 91,664 [64] 40 (23) [338] 427 88
Commodity-related instruments Commodity futures Short
786
322
934 (86) (86)
Natural catastrophe derivatives Short
60,029 30,929 [7,278] 5,502 1,775 [2,522] 1,269 1,253
Long
73,274 19,000 [9,651] 7,879 (1,772) [641] (47) (689)
Weather derivatives Short
13 19 [1] [2] 2
Others Short
22,600 22,200 [2,599] 2,147 452 [2,553] 1,445 1,107
Long
12,016 11,339 [1,169] 1,289 120 [1,148] 1,001 (147)
Total
― 64,574 23,974 ― 24,470 9,208
(Note) 1. For option contracts, option premiums are denoted with [ ].
- 2. Transactions to which hedge accounting is applied are not included in the table above.
21