SLIDE 1 Summary of Consolidated Business Results of Tokio Marine Holdings, Inc. under Japanese GAAP for the nine months ended December 31, 2019
February 14, 2020 Company Name: Tokio Marine Holdings, Inc. (the "Company") Stock Exchange Listing: Tokyo Securities Code Number: 8766 (URL: https://www.tokiomarinehd.com/en/) Representative: Satoru Komiya, President Contact: Tetsuya Hirano, Corporate Planning Dept. (Tel: +81-3-5223-3212) Scheduled date to file Quarterly Securities Report: February 14, 2020 Scheduled date to commence dividend payments: Not applicable Supplementary information for quarterly financial statements: Available Quarterly IR Conference Call: None (Note) All amounts are rounded down and all percentages are rounded.
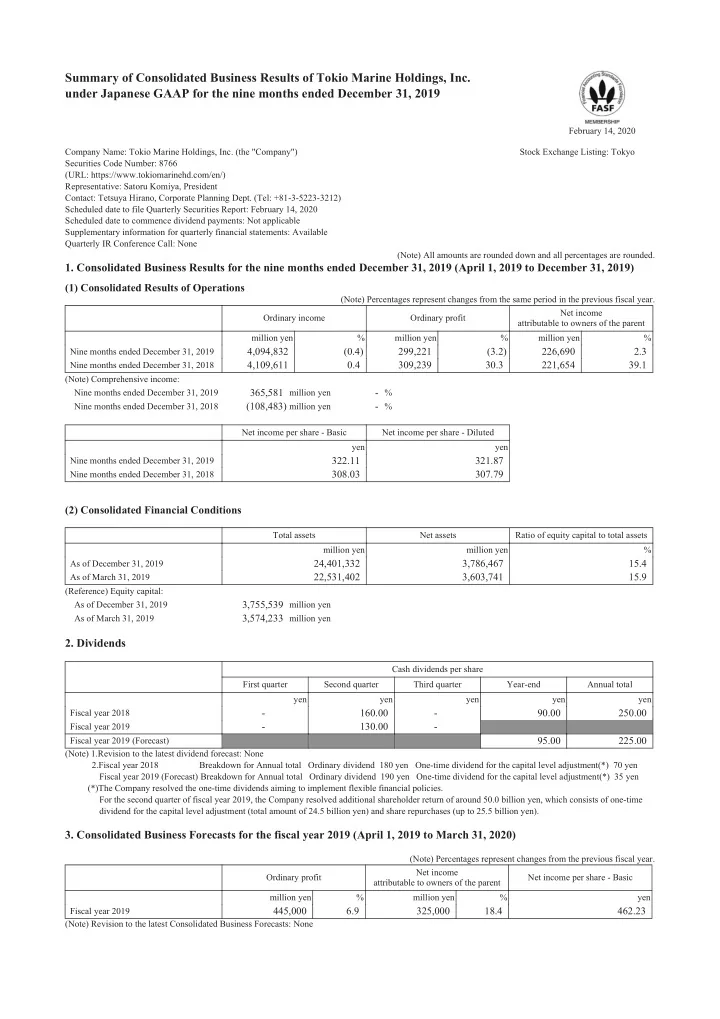
- 1. Consolidated Business Results for the nine months ended December 31, 2019 (April 1, 2019 to December 31, 2019)
(1) Consolidated Results of Operations
(Note) Percentages represent changes from the same period in the previous fiscal year. Ordinary income Ordinary profit Net income attributable to owners of the parent million yen % million yen % million yen % Nine months ended December 31, 2019
4,094,832 (0.4) 299,221 (3.2) 226,690 2.3
Nine months ended December 31, 2018
4,109,611 0.4 309,239 30.3 221,654 39.1
(Note) Comprehensive income: Nine months ended December 31, 2019
365,581 million yen
Nine months ended December 31, 2018
(108,483) million yen
Net income per share - Basic Net income per share - Diluted yen yen Nine months ended December 31, 2019
322.11 321.87
Nine months ended December 31, 2018
308.03 307.79
(2) Consolidated Financial Conditions
Total assets Net assets Ratio of equity capital to total assets million yen million yen % As of December 31, 2019
24,401,332 3,786,467 15.4
As of March 31, 2019
22,531,402 3,603,741 15.9
(Reference) Equity capital: As of December 31, 2019
3,755,539 million yen
As of March 31, 2019
3,574,233 million yen
Cash dividends per share First quarter Second quarter Third quarter Year-end Annual total yen yen yen yen yen Fiscal year 2018
250.00
Fiscal year 2019
- 130.00
- Fiscal year 2019 (Forecast)
95.00 225.00
(Note) 1.Revision to the latest dividend forecast: None 2.Fiscal year 2018 Breakdown for Annual total Ordinary dividend 180 yen One-time dividend for the capital level adjustment(*) 70 yen Fiscal year 2019 (Forecast) Breakdown for Annual total Ordinary dividend 190 yen One-time dividend for the capital level adjustment(*) 35 yen (*)The Company resolved the one-time dividends aiming to implement flexible financial policies. For the second quarter of fiscal year 2019, the Company resolved additional shareholder return of around 50.0 billion yen, which consists of one-time dividend for the capital level adjustment (total amount of 24.5 billion yen) and share repurchases (up to 25.5 billion yen).
- 3. Consolidated Business Forecasts for the fiscal year 2019 (April 1, 2019 to March 31, 2020)
(Note) Percentages represent changes from the previous fiscal year. Ordinary profit Net income attributable to owners of the parent Net income per share - Basic million yen % million yen % yen Fiscal year 2019
445,000 6.9 325,000 18.4 462.23
(Note) Revision to the latest Consolidated Business Forecasts: None
Summary
SLIDE 2
* Notes
(1) Changes in significant subsidiaries during the nine months ended December 31, 2019 (Changes in specified subsidiaries that resulted in a change in the scope of consolidation): None (2) Adoption of accounting methods that are specific to quarterly consolidated financial reports: None (3) Changes in accounting policies, changes in accounting estimates, and retrospective restatements (a) Changes in accounting policies to reflect amendments of accounting standards: None (b) Changes in accounting policies other than (a): None (c) Changes in accounting estimates: None (d) Retrospective restatements: None (4) Number of shares issued (common stock) (a) Total number of shares issued including treasury stock As of December 31, 2019
710,000,000 shares
As of March 31, 2019
710,000,000 shares
(b) Number of treasury stock held As of December 31, 2019
8,849,247 shares
As of March 31, 2019
3,443,216 shares
(c) Average number of shares outstanding During the nine months ended December 31, 2019
703,750,640 shares
During the nine months ended December 31, 2018
719,570,754 shares
* "Summary of Consolidated Business Results" is outside the scope of external auditor's quarterly review. * Notes concerning the business forecasts and other items
Business forecasts are prepared based on certain assumptions and information available to the Company as of the release date of this document, and actual results may significantly differ depending on various factors.
Summary
SLIDE 3 Tokio Marine Holdings, Inc.
Contents of Appendix
- 1. Consolidated Financial Statements and Major Notes ………………………………………………………………………………...
2 (1) Consolidated Balance Sheet …………………………………………………………………………………………………….….. 2 (2) Consolidated Statement of Income and Consolidated Statement of Comprehensive Income ………………………………….….. 3 (3) Notes regarding going concern assumption ……………………………………………………………………………………..…. 5 (4) Notes regarding significant changes in shareholders’ equity ……………………………………………………………………... 5 (5) Additional Information…………………………………………………………………………………………………………….. 5
- 2. Others …………………………………………………………………………………………………………………………........
6 (1) Summary of Consolidated Business Results …………………………………………………………………………………….... 6 (2) Premiums written and claims paid by lines of business ………………………………………………………………………....... 7 (3) Securities ………………………………………………………………………………………………………………………..…. 8 (4) Financial results of major consolidated subsidiaries …………………………………………………………………………....... 9
- Tokio Marine & Nichido Fire Insurance Co., Ltd. (non-consolidated) ………………………………………………………….
9
- Nisshin Fire & Marine Insurance Co., Ltd. (non-consolidated) ……………………………………………………………….. 13
- E.design Insurance Co., Ltd. (non-consolidated) …………………………………………………………………………….…
17
- Tokio Marine & Nichido Life Insurance Co., Ltd. (non-consolidated) ……………………………………………………...…..
19 Glossary of terminology ……………………………………………………………………………………………………….… 24 1 Contents of Appendix
SLIDE 4 Tokio Marine Holdings, Inc.
- 1. Consolidated Financial Statements and Major Notes
(1) Consolidated Balance Sheet
(Yen in millions) As of March 31, 2019 As of December 31, 2019 Assets Cash and bank deposits
851,657 839,280
Call loans
Receivables under resale agreements
999 4,999
Receivables under securities borrowing transactions
9,084 1,930
Monetary receivables bought
1,468,952 1,413,521
Money trusts
2,156 2,231
Securities
16,502,611 18,108,254
Loans
932,167 1,290,114
Tangible fixed assets
293,257 307,981
Intangible fixed assets
767,598 703,683
Other assets
1,664,969 1,694,655
Net defined benefit assets
17,515 17,590
Deferred tax assets
29,511 26,061
Customers' liabilities under acceptances and guarantees
2,230 2,114
Allowance for doubtful accounts
(11,308) (11,087)
Total assets
22,531,402 24,401,332
Liabilities Insurance liabilities
16,416,905 16,846,889
Outstanding claims
2,863,815 2,933,766
Underwriting reserves
13,553,090 13,913,122
Corporate bonds
57,514 255,772
Other liabilities
1,692,804 2,708,391
Net defined benefit liabilities
254,430 259,068
Provision for employees' bonus
61,371 45,025
Reserves under special laws
108,457 115,104
Reserve for price fluctuation
108,457 115,104
Deferred tax liabilities
294,805 351,028
Negative goodwill
39,140 31,468
Acceptances and guarantees
2,230 2,114
Total liabilities
18,927,661 20,614,865
Net assets Shareholders' equity Share capital
150,000 150,000
Retained earnings
1,742,188 1,812,286
Treasury stock
(18,299) (49,021)
Total shareholders' equity
1,873,889 1,913,265
Accumulated other comprehensive income Unrealized gains (losses) on available-for-sale securities
1,676,369 1,882,495
Deferred gains (losses) on hedge transactions
9,472 9,816
Foreign currency translation adjustments
24,892 (41,736)
Remeasurements of defined benefit plans
(10,389) (8,302)
Total accumulated other comprehensive income
1,700,344 1,842,273
Stock acquisition rights
2,479 2,343
Non-controlling interests
27,027 28,584
Total net assets
3,603,741 3,786,467
Total liabilities and net assets
22,531,402 24,401,332
2 (1) Consolidated Balance Sheet
SLIDE 5 Tokio Marine Holdings, Inc.
(2) Consolidated Statement of Income and Consolidated Statement of Comprehensive Income
(Consolidated Statement of Income)
(Yen in millions) Nine months ended December 31, 2018 (April 1, 2018 to December 31, 2018) Nine months ended December 31, 2019 (April 1, 2019 to December 31, 2019) Ordinary income
4,109,611 4,094,832
Underwriting income
3,567,976 3,519,620
Net premiums written
2,748,087 2,710,296
Deposit premiums from policyholders
64,515 64,494
Investment income on deposit premiums
31,433 30,684
Life insurance premiums
720,690 710,267
Investment income
452,879 487,411
Interest and dividends
376,216 382,411
Gains on money trusts
12 75
Gains on trading securities
5,823 22,199
Gains on sales of securities
94,455 95,319
Gains on redemption of securities
1,247 304
Investment gains on separate accounts
Transfer of investment income on deposit premiums
(31,433) (30,684)
Other ordinary income
88,756 87,799
Amortization of negative goodwill
7,671 7,671
Ordinary expenses
3,800,372 3,795,611
Underwriting expenses
3,081,719 3,075,011
Net claims paid
1,595,331 1,547,768
Loss adjustment expenses
105,644 107,131
Agency commissions and brokerage
532,743 510,781
Maturity refunds to policyholders
113,360 106,921
Dividends to policyholders
26 17
Life insurance claims
379,870 323,367
Provision for outstanding claims
192,468 125,277
Provision for underwriting reserves
158,968 350,461
Investment expenses
55,068 46,850
Losses on money trusts
1,540
- Losses on sales of securities
12,029 6,570
Impairment losses on securities
5,317 2,017
Losses on redemption of securities
527 378
Losses on derivatives
4,518 28,249
Investment losses on separate accounts
15,112
- Operating and general administrative expenses
642,107 652,912
Other ordinary expenses
21,476 20,836
Interest expenses
12,680 13,250
Increase in allowance for doubtful accounts
345 458
Losses on bad debts
214 56
Equity in losses of affiliates
2,093 3,439
Amortization of deferred assets under Article 113 of the Insurance Business Act
2,870
309,239 299,221
3 (2) Consolidated Statement of Income and Consolidated Statement of Comprehensive Income
SLIDE 6
Tokio Marine Holdings, Inc.
(Yen in millions) Nine months ended December 31, 2018 (April 1, 2018 to December 31, 2018) Nine months ended December 31, 2019 (April 1, 2019 to December 31, 2019) Extraordinary gains
4,286 9,238
Gains on disposal of fixed assets
911 123
Gains on step acquisitions
2,976 4,119
Gains on sales of investment in subsidiaries and affiliates
103 4,323
Other extraordinary gains
294 671
Extraordinary losses
8,230 8,875
Losses on disposal of fixed assets
802 1,159
Impairment losses on fixed assets
1,372 1,067
Provision for reserves under special laws
6,056 6,647
Provision for reserve for price fluctuation
6,056 6,647
Income before income taxes and non-controlling interests
305,295 299,584
Income taxes - current
81,047 77,878
Income taxes - deferred
1,382 (6,896)
Total income taxes
82,430 70,982
Net income
222,865 228,601
Net income attributable to non-controlling interests
1,211 1,911
Net income attributable to owners of the parent
221,654 226,690
4 (2) Consolidated Statement of Income and Consolidated Statement of Comprehensive Income
SLIDE 7 Tokio Marine Holdings, Inc.
(Consolidated Statement of Comprehensive Income)
(Yen in millions) Nine months ended December 31, 2018 (April 1, 2018 to December 31, 2018) Nine months ended December 31, 2019 (April 1, 2019 to December 31, 2019) Net income
222,865 228,601
Other comprehensive income Unrealized gains (losses) on available-for-sale securities
(317,668) 203,040
Deferred gains (losses) on hedge transactions
(2,481) (216)
Foreign currency translation adjustments
(9,943) (63,222)
Remeasurements of defined benefit plans
1,822 2,090
Share of other comprehensive income of affiliates accounted for by the equity method
(3,078) (4,711)
Total other comprehensive income
(331,348) 136,979
Total comprehensive income
(108,483) 365,581
Comprehensive income attributable to: Owners of the parent
(108,514) 363,418
Non-controlling interests
30 2,162
(3) Notes regarding going concern assumption
Not applicable.
(4) Notes regarding significant changes in shareholders’ equity
Not applicable.
(5) Additional Information
Consolidated overseas subsidiaries that apply US GAAP have adopted Accounting Standards Update 2016-01: Recognition and Measurement of Financial Assets and Financial Liabilities (hereinafter referred to as "ASU 2016-01") issued by the Financial Accounting Standards Board from the beginning of the fiscal year 2019. ASU 2016-01 requires equity investments (except those accounted for under the equity method of accounting or those that result in consolidation of the investee) to be measured at fair value with changes in fair value recognized in net income or loss. In accordance with ASU 2016-01, the Company has recognized the changes in fair value for certain equity investments in net income
- r loss from the beginning of the fiscal year 2019, which were previously recognized in Other comprehensive income. The
Company has reclassified Unrealized losses on available-for-sale securities (3,565 million yen) to Retained earnings at the beginning of the fiscal year 2019, and certain securities that were classified in Available-for-sale securities at the end of the fiscal year 2018 (65,355 million yen) have been included in Trading securities. The impacts to Ordinary profit and Income before income taxes and non-controlling interests for the nine months ended December 31, 2019 are immaterial. 5 (2) Consolidated Statement of Income and Consolidated Statement of Comprehensive Income
SLIDE 8 Tokio Marine Holdings, Inc.
(1) Summary of Consolidated Business Results
(Yen in millions) Nine months ended December 31, 2018 (April 1, 2018 to December 31, 2018) Nine months ended December 31, 2019 (April 1, 2019 to December 31, 2019) Increase (Decrease) Rate of change Ordinary income and expenses % Underwriting income
3,567,976 3,519,620 (48,355) (1.4)
Net premiums written
2,748,087 2,710,296 (37,790) (1.4)
Deposit premiums from policyholders
64,515 64,494 (21) (0.0)
Life insurance premiums
720,690 710,267 (10,422) (1.4)
Underwriting expenses
3,081,719 3,075,011 (6,707) (0.2)
Net claims paid
1,595,331 1,547,768 (47,562) (3.0)
Loss adjustment expenses
105,644 107,131 1,486 1.4
Agency commissions and brokerage
532,743 510,781 (21,962) (4.1)
Maturity refunds to policyholders
113,360 106,921 (6,439) (5.7)
Life insurance claims
379,870 323,367 (56,502) (14.9)
Provision for outstanding claims
192,468 125,277 (67,191) (34.9)
Provision for underwriting reserves
158,968 350,461 191,493 120.5
Investment income
452,879 487,411 34,532 7.6
Interest and dividends
376,216 382,411 6,195 1.6
Gains on money trusts
12 75 62 504.3
Gains on trading securities
5,823 22,199 16,375 281.2
Gains on sales of securities
94,455 95,319 863 0.9
Investment gains on separate accounts
13,597
55,068 46,850 (8,217) (14.9)
Losses on money trusts
1,540
(100.0)
Losses on sales of securities
12,029 6,570 (5,458) (45.4)
Impairment losses on securities
5,317 2,017 (3,300) (62.1)
Losses on derivatives
4,518 28,249 23,730 525.1
Investment losses on separate accounts
15,112
(100.0)
Operating and general administrative expenses
642,107 652,912 10,804 1.7
Other ordinary income and expenses
67,279 66,962 (316) (0.5)
Equity in earnings (losses) of affiliates
(2,093) (3,439) (1,346)
309,239 299,221 (10,018) (3.2)
Extraordinary gains and losses Extraordinary gains
4,286 9,238 4,951 115.5
Extraordinary losses
8,230 8,875 644 7.8
Extraordinary gains (losses)
(3,943) 363 4,306
- Income before income taxes and
non-controlling interests
305,295 299,584 (5,711) (1.9)
Income taxes - current
81,047 77,878 (3,169) (3.9)
Income taxes - deferred
1,382 (6,896) (8,278) (598.8)
Total income taxes
82,430 70,982 (11,448) (13.9)
Net income
222,865 228,601 5,736 2.6
Net income attributable to non-controlling interests
1,211 1,911 700 57.8
Net income attributable to owners of the parent
221,654 226,690 5,036 2.3
6 (1) Summary of Consolidated Business Results
SLIDE 9
Tokio Marine Holdings, Inc.
(2) Premiums written and claims paid by lines of business
Direct premiums written including deposit premiums from policyholders
(Yen in millions) Nine months ended December 31, 2018 (April 1, 2018 to December 31, 2018) Nine months ended December 31, 2019 (April 1, 2019 to December 31, 2019) Amount Composition ratio Rate of change Amount Composition ratio Rate of change
% % % %
Fire and allied lines
484,489 16.3 3.7 532,627 17.4 9.9
Hull and cargo
92,614 3.1 (0.5) 102,294 3.3 10.5
Personal accident
231,071 7.8 (5.1) 233,498 7.6 1.1
Voluntary automobile
1,051,513 35.3 (0.5) 1,077,024 35.2 2.4
Compulsory automobile liability
208,550 7.0 (1.5) 212,962 7.0 2.1
Others
910,537 30.6 6.8 902,299 29.5 (0.9)
Total
2,978,776 100.0 1.8 3,060,705 100.0 2.8
Deposit premiums from policyholders
64,515 2.2 (15.8) 64,494 2.1 (0.0)
(Note) Direct premiums written including deposit premiums from policyholders = Gross premiums written - Surrender benefits of direct policies - Other refunds of direct policies (including deposit premiums from policyholders)
Net premiums written
(Yen in millions) Nine months ended December 31, 2018 (April 1, 2018 to December 31, 2018) Nine months ended December 31, 2019 (April 1, 2019 to December 31, 2019) Amount Composition ratio Rate of change Amount Composition ratio Rate of change
% % % %
Fire and allied lines
417,521 15.2 5.7 410,306 15.1 (1.7)
Hull and cargo
81,786 3.0 (0.3) 83,541 3.1 2.1
Personal accident
168,761 6.1 (0.5) 166,110 6.1 (1.6)
Voluntary automobile
1,069,057 38.9 (1.7) 1,077,199 39.7 0.8
Compulsory automobile liability
214,366 7.8 (7.2) 223,624 8.3 4.3
Others
796,594 29.0 6.2 749,514 27.7 (5.9)
Total
2,748,087 100.0 1.2 2,710,296 100.0 (1.4)
Net claims paid
(Yen in millions) Nine months ended December 31, 2018 (April 1, 2018 to December 31, 2018) Nine months ended December 31, 2019 (April 1, 2019 to December 31, 2019) Amount Composition ratio Rate of change Amount Composition ratio Rate of change
% % % %
Fire and allied lines
377,411 23.7 72.1 307,349 19.9 (18.6)
Hull and cargo
46,443 2.9 4.8 48,707 3.1 4.9
Personal accident
76,964 4.8 (0.4) 77,814 5.0 1.1
Voluntary automobile
611,316 38.3 3.8 611,133 39.5 (0.0)
Compulsory automobile liability
165,145 10.4 (1.1) 154,354 10.0 (6.5)
Others
318,049 19.9 0.9 348,409 22.5 9.5
Total
1,595,331 100.0 13.0 1,547,768 100.0 (3.0)
7 (2) Premiums written and claims paid by lines of business
SLIDE 10 Tokio Marine Holdings, Inc.
(3) Securities
- 1. Bonds held to maturity
(Yen in millions) As of March 31, 2019 As of December 31, 2019 Carrying amount shown on balance sheet Fair value Unrealized gains (losses) Carrying amount shown on balance sheet Fair value Unrealized gains (losses) Domestic debt securities
4,633,859 5,522,062 888,203 4,871,006 5,811,151 940,145
Foreign securities
40,210 40,379 168 41,607 45,729 4,121
Total
4,674,069 5,562,441 888,372 4,912,614 5,856,881 944,266
- 2. Bonds earmarked for underwriting reserves
(Yen in millions) As of March 31, 2019 As of December 31, 2019 Carrying amount shown on balance sheet Fair value Unrealized gains (losses) Carrying amount shown on balance sheet Fair value Unrealized gains (losses) Domestic debt securities
363,588 383,613 20,025 1,489,699 1,511,511 21,811
Foreign securities
13,442 13,537 94 11,699 11,972 273
Total
377,030 397,151 20,120 1,501,398 1,523,483 22,084
- 3. Available-for-sale securities
(Yen in millions) As of March 31, 2019 As of December 31, 2019 Cost Fair value shown on balance sheet Unrealized gains (losses) Cost Fair value shown on balance sheet Unrealized gains (losses) Domestic debt securities
3,427,380 3,887,659 460,278 3,475,393 3,927,748 452,355
Domestic equity securities
598,507 2,383,165 1,784,657 568,605 2,432,655 1,864,050
Foreign securities
4,233,512 4,325,803 92,290 4,247,014 4,541,942 294,927
Others
1,498,845 1,492,008 (6,837) 1,431,007 1,459,913 28,905
Total
9,758,246 12,088,637 2,330,390 9,722,020 12,362,259 2,640,238
(Note) 1. Available-for-sale securities whose fair value cannot be measured reliably are not included in the table above.
- 2. "Others" includes items as follows:
- Negotiable certificates of deposit which are presented as Cash and bank deposits on the consolidated balance sheet
As of March 31, 2019: cost 5,424 million yen, fair value 5,424 million yen As of December 31, 2019: cost 30,446 million yen, fair value 30,446 million yen
- Foreign mortgage securities, etc. which are presented as Monetary receivables bought on the consolidated balance sheet
As of March 31, 2019: cost 1,475,313 million yen, fair value 1,467,460 million yen, unrealized losses (7,852) million yen As of December 31, 2019: cost 1,384,929 million yen, fair value 1,411,861 million yen, unrealized gains 26,932 million yen
- 3. Impairment losses were recognized for Available-for-sale securities with fair value as follows:
- Fiscal year 2018: 11,018 million yen (Domestic equity securities 4,322 million yen, Foreign securities 5,294 million yen, Others 1,401 million yen)
- Nine months ended December 31, 2019: 3,856 million yen (Domestic equity securities 1,205 million yen, Foreign securities 582 million yen, Others
2,069 million yen) In principle, impairment loss on a security with fair value is recognized when the fair value is below its cost by 30% or more.
8 (3) Securities
SLIDE 11 Tokio Marine Holdings, Inc.
(4) Financial results of major consolidated subsidiaries
Reference : Tokio Marine & Nichido Fire Insurance Co., Ltd. (non-consolidated)
Balance sheet
(Yen in millions) As of March 31, 2019 As of December 31, 2019 Increase (Decrease) Amount Composition ratio Amount Composition ratio Assets
% %
Cash and bank deposits
419,530 4.47 352,275 3.66 (67,254)
Receivables under resale agreements
999 0.01 4,999 0.05 3,999
Monetary receivables bought
101,536 1.08 216,225 2.25 114,688
Money trusts
2,156 0.02 2,231 0.02 75
Securities
7,803,911 83.08 7,985,386 82.99 181,474
Loans
135,094 1.44 170,439 1.77 35,345
Tangible fixed assets
211,184 2.25 211,692 2.20 508
Intangible fixed assets
523 0.01 523 0.01 (0)
Other assets
711,622 7.58 673,632 7.00 (37,989)
Prepaid pension costs
7,567 0.08 6,267 0.07 (1,300)
Customers’ liabilities under acceptances and guarantees
2,230 0.02 2,114 0.02 (116)
Allowance for doubtful accounts
(3,318) (0.04) (3,319) (0.03) (0)
Total assets
9,393,039 100.00 9,622,469 100.00 229,430
Liabilities Insurance liabilities
5,288,084 56.30 5,290,044 54.98 1,960
Outstanding claims
975,348 1,014,204 38,856
Underwriting reserves
4,312,735 4,275,839 (36,895)
Corporate bonds
10,100 0.11 210,100 2.18 200,000
Other liabilities
736,572 7.84 679,723 7.06 (56,848)
Income taxes payable
27,691 2,884 (24,806)
Lease obligations
3,020 3,893 873
Asset retirement obligations
3,450 3,472 21
Other liabilities
702,408 669,472 (32,936)
Provision for retirement benefits
209,059 2.23 212,985 2.21 3,926
Provision for employees’ bonus
14,737 0.16 6,129 0.06 (8,608)
Reserves under special laws
96,859 1.03 101,055 1.05 4,195
Reserve for price fluctuation
96,859 101,055 4,195
Deferred tax liabilities
146,344 1.56 171,105 1.78 24,760
Acceptances and guarantees
2,230 0.02 2,114 0.02 (116)
Total liabilities
6,503,988 69.24 6,673,258 69.35 169,270
Net assets Share capital
101,994 1.09 101,994 1.06
133,625 1.42 133,625 1.39
- Additional paid-in capital
123,521 123,521
10,104 10,104
1,185,780 12.62 1,185,494 12.32 (286)
Surplus reserve
81,099 81,099
1,104,681 1,104,394 (286)
Reserve for special depreciation
10 10
- Reserve for advanced depreciation of fixed assets
23,963 23,963
235,426 235,426
- Retained earnings carried forward
845,281 844,995 (286)
Total shareholders’ equity
1,421,401 15.13 1,421,114 14.77 (286)
Unrealized gains (losses) on available-for-sale securities
1,479,305 15.75 1,537,530 15.98 58,224
Deferred gains (losses) on hedge transactions
(11,655) (0.12) (9,433) (0.10) 2,221
Total valuation and translation adjustments
1,467,649 15.62 1,528,096 15.88 60,446
Total net assets
2,889,050 30.76 2,949,210 30.65 60,160
Total liabilities and net assets
9,393,039 100.00 9,622,469 100.00 229,430
9 Balance sheet
SLIDE 12 Tokio Marine Holdings, Inc.
Reference : Tokio Marine & Nichido Fire Insurance Co., Ltd. (non-consolidated)
Statement of income
(Yen in millions) Nine months ended December 31, 2018 ( April 1, 2018 to December 31, 2018 ) Nine months ended December 31, 2019 ( April 1, 2019 to December 31, 2019 ) Increase (Decrease) Ordinary income
2,054,309 2,032,573 (21,735)
Underwriting income
1,848,621 1,816,874 (31,746)
Net premiums written
1,621,450 1,687,101 65,651
Deposit premiums from policyholders
63,187 63,353 165
Investment income on deposit premiums
30,156 29,372 (783)
Reversal of underwriting reserves
133,743 36,895 (96,847)
Investment income
198,400 207,555 9,154
Interest and dividends
150,469 159,768 9,299
Gains on money trusts
12 75 62
Gains on sales of securities
74,736 75,840 1,104
Transfer of investment income on deposit premiums
(30,156) (29,372) 783
Other ordinary income
7,286 8,143 856
Ordinary expenses
1,863,932 1,835,536 (28,395)
Underwriting expenses
1,618,666 1,575,129 (43,536)
Net claims paid
1,056,297 1,039,309 (16,988)
Loss adjustment expenses
82,313 83,435 1,122
Agency commissions and brokerage
293,957 308,635 14,677
Maturity refunds to policyholders
108,809 103,523 (5,285)
Provision for outstanding claims
76,152 38,856 (37,296)
Investment expenses
11,756 19,612 7,855
Losses on money trusts
1,540
Losses on sales of securities
1,263 1,216 (47)
Impairment losses on securities
3,610 1,462 (2,147)
Operating and general administrative expenses
226,776 233,070 6,294
Other ordinary expenses
6,733 7,724 991
Interest expenses
6,261 6,150 (110)
Ordinary profit (loss)
190,376 197,037 6,660
Extraordinary gains
998 3,556 2,557
Gains on disposal of fixed assets
888 76 (811)
Gains on sales of investment in subsidiaries and affiliates
103 3,479 3,376
Gains on liquidation of subsidiaries and affiliates
6
Extraordinary losses
5,749 13,220 7,470
Losses on disposal of fixed assets
691 964 273
Impairment losses on fixed assets
871 302 (568)
Provision for reserves under special laws
4,187 4,195 8
Provision for reserve for price fluctuation
4,187 4,195 8
Impairment losses on investment in subsidiaries and affiliates
7,757
Income (loss) before income taxes
185,625 187,373 1,748
Income taxes - current
39,527 30,181 (9,345)
Income taxes - deferred
(6,511) 881 7,393
Total income taxes
33,015 31,063 (1,951)
Net income (loss)
152,609 156,309 3,700
Underwriting profit (loss)
28,463 36,227 7,763
Loss ratio (W/P basis)
70.2 % 66.5 % (3.7)%
Expense ratio (W/P basis)
30.4 30.3 (0.1)
Combined ratio (W/P basis)
100.6 96.8 (3.8)
Loss ratio (private sector, E/I basis)
73.7 69.8 (3.9)
Expense ratio (private sector)
31.9 31.7 (0.2)
Combined ratio (private sector)
105.6 101.5 (4.1)
10 Statement of income
SLIDE 13 Tokio Marine Holdings, Inc.
Reference : Tokio Marine & Nichido Fire Insurance Co., Ltd. (non-consolidated)
Underwriting
Direct premiums written excluding deposit premiums from policyholders
(Yen in millions) Nine months ended December 31, 2018 ( April 1, 2018 to December 31, 2018 ) Nine months ended December 31, 2019 ( April 1, 2019 to December 31, 2019 ) Amount Composition ratio Rate of change Amount Composition ratio Rate of change
% % % %
Fire and allied lines
271,264 15.1 5.7 316,707 17.0 16.8
Hull and cargo
49,564 2.8 4.1 52,137 2.8 5.2
Personal accident
138,956 7.7 2.3 141,489 7.6 1.8
Voluntary automobile
799,643 44.6 0.0 807,239 43.3 1.0
Compulsory automobile liability
194,848 10.9 (1.4) 199,623 10.7 2.5
Others
339,765 18.9 2.8 347,710 18.6 2.3
Total
1,794,041 100.0 1.5 1,864,908 100.0 4.0
Deposit premiums from policyholders
63,187
63,353
Net premiums written
(Yen in millions) Nine months ended December 31, 2018 ( April 1, 2018 to December 31, 2018 ) Nine months ended December 31, 2019 ( April 1, 2019 to December 31, 2019 ) Amount Composition ratio Rate of change Amount Composition ratio Rate of change
% % % %
Fire and allied lines
209,593 12.9 2.2 242,613 14.4 15.8
Hull and cargo
46,923 2.9 8.6 48,524 2.9 3.4
Personal accident
134,857 8.3 2.4 138,116 8.2 2.4
Voluntary automobile
796,638 49.1 (0.1) 804,629 47.7 1.0
Compulsory automobile liability
201,139 12.4 (7.0) 210,242 12.5 4.5
Others
232,297 14.3 5.8 242,974 14.4 4.6
Total
1,621,450 100.0 0.5 1,687,101 100.0 4.0 Net claims paid
(Yen in millions) Nine months ended December 31, 2018 ( April 1, 2018 to December 31, 2018 ) Nine months ended December 31, 2019 ( April 1, 2019 to December 31, 2019 ) Amount Rate of change Loss ratio Amount Rate of change Loss ratio
% % % %
Fire and allied lines
251,121 112.0 122.3 218,207 (13.1) 92.4
Hull and cargo
29,077 13.4 65.3 32,195 10.7 69.6
Personal accident
60,797 0.5 50.9 64,375 5.9 51.8
Voluntary automobile
450,671 5.2 62.4 458,810 1.8 63.0
Compulsory automobile liability
154,498 (1.0) 83.8 144,766 (6.3) 75.1
Others
110,130 (16.7) 50.6 120,954 9.8 52.7
Total
1,056,297 14.6 70.2 1,039,309 (1.6) 66.5
(Note) Loss ratio is calculated on W/P basis.
11 Underwriting
SLIDE 14 Tokio Marine Holdings, Inc.
Reference : Tokio Marine & Nichido Fire Insurance Co., Ltd. (non-consolidated)
Solvency margin ratio (non-consolidated)
(Yen in millions) As of March 31, 2019 As of December 31, 2019 (A) Total amount of solvency margin
4,891,588 5,199,812
Shareholders’ equity less adjusting items
1,345,853 1,421,114
Reserve for price fluctuation
96,859 101,055
Contingency reserve
5,449 6,500
Catastrophe loss reserve
979,088 891,039
General allowance for doubtful accounts
240 165
Unrealized gains (losses) on available-for-sale securities and deferred gains (losses)
- n hedge transactions before tax effect deductions
1,840,342 1,914,599
Unrealized gains (losses) on land
216,476 229,053
Excess of policyholders’ contract deposits
- Subordinated debt, etc.
- 200,000
Amounts within "Excess of policyholders’ contract deposits" and "Subordinated debt, etc." not calculated into the margin
407,277 436,284
(B) Total amount of risks
(R1+R2)2+(R3+R4)2+R5+R6
1,185,150 1,165,168
General insurance risk (R1)
184,654 185,938
Third sector insurance risk (R2)
- Assumed interest rate risk
(R3)
20,092 19,735
Asset management risk (R4)
963,630 957,229
Business administration risk (R5)
26,522 26,148
Catastrophe risk (R6)
157,725 144,518
(C) Solvency margin ratio [(A)/{(B)×1/2}]×100
825.4% 892.5%
(Note) Solvency margin ratio as of December 31, 2019 is calculated partially based on the data as of September 30, 2019.
12 Solvency margin ratio (non-consolidated)
SLIDE 15 Tokio Marine Holdings, Inc.
Reference : Nisshin Fire & Marine Insurance Co., Ltd. (non-consolidated)
Balance sheet
(Yen in millions) As of March 31, 2019 As of December 31, 2019 Increase (Decrease) Amount Composition ratio Amount Composition ratio Assets
% %
Cash and bank deposits
38,881 9.81 41,139 10.65 2,258
Securities
275,440 69.47 270,683 70.06 (4,757)
Loans
213 0.05 189 0.05 (24)
Tangible fixed assets
28,914 7.29 28,946 7.49 32
Intangible fixed assets
91 0.02 91 0.02
38,371 9.68 30,722 7.95 (7,648)
Prepaid pension costs
1,540 0.39 1,607 0.42 66
Deferred tax assets
13,249 3.34 13,278 3.44 28
Allowance for doubtful accounts
(228) (0.06) (311) (0.08) (82)
Total assets
396,474 100.00 386,348 100.00 (10,126)
Liabilities Insurance liabilities
285,395 71.98 286,456 74.14 1,061
Outstanding claims
48,996 51,582 2,585
Underwriting reserves
236,398 234,874 (1,524)
Other liabilities
15,400 3.88 12,589 3.26 (2,810)
Income taxes payable
406 225 (181)
Asset retirement obligations
11 10 (0)
Other liabilities
14,982 12,353 (2,629)
Provision for retirement benefits
3,110 0.78 3,792 0.98 681
Provision for employees’ bonus
534 0.13
Reserves under special laws
1,516 0.38 1,627 0.42 111
Reserve for price fluctuation
1,516 1,627 111
Total liabilities
305,957 77.17 304,465 78.81 (1,491)
Net assets Share capital
20,389 5.14 20,389 5.28
15,518 3.91 15,518 4.02
- Additional paid-in capital
12,620 12,620
2,898 2,898
21,023 5.30 12,653 3.28 (8,370)
Surplus reserve
7,769 7,769
13,254 4,884 (8,370)
Reserve for advanced depreciation of fixed assets
1,678 1,678
- Retained earnings carried forward
11,575 3,205 (8,370)
Total shareholders’ equity
56,932 14.36 48,561 12.57 (8,370)
Unrealized gains (losses) on available-for-sale securities
33,585 8.47 33,320 8.62 (264)
Total valuation and translation adjustments
33,585 8.47 33,320 8.62 (264)
Total net assets
90,517 22.83 81,882 21.19 (8,634)
Total liabilities and net assets
396,474 100.00 386,348 100.00 (10,126)
13 Balance sheet
SLIDE 16 Tokio Marine Holdings, Inc.
Reference : Nisshin Fire & Marine Insurance Co., Ltd. (non-consolidated)
Statement of income
(Yen in millions) Nine months ended December 31, 2018 ( April 1, 2018 to December 31, 2018 ) Nine months ended December 31, 2019 ( April 1, 2019 to December 31, 2019 ) Increase (Decrease) Ordinary income
125,055 119,851 (5,204)
Underwriting income
121,988 117,220 (4,768)
Net premiums written
108,894 113,246 4,352
Deposit premiums from policyholders
1,328 1,140 (187)
Investment income on deposit premiums
1,264 1,296 31
Reversal of underwriting reserves
10,493 1,524 (8,968)
Investment income
3,011 2,550 (461)
Interest and dividends
3,139 3,061 (77)
Gains on sales of securities
864 689 (174)
Gains on redemption of securities
268 90 (178)
Transfer of investment income on deposit premiums
(1,264) (1,296) (31)
Other ordinary income
55 80 25
Ordinary expenses
123,531 119,396 (4,135)
Underwriting expenses
104,958 100,700 (4,258)
Net claims paid
69,803 67,026 (2,777)
Loss adjustment expenses
7,553 7,483 (70)
Agency commissions and brokerage
18,976 20,021 1,044
Maturity refunds to policyholders
4,550 3,397 (1,153)
Provision for outstanding claims
3,848 2,585 (1,263)
Investment expenses
520 837 316
Losses on sales of securities
14 16 1
Impairment losses on securities
66 57 (8)
Operating and general administrative expenses
17,880 17,694 (186)
Other ordinary expenses
172 164 (7)
Ordinary profit (loss)
1,524 454 (1,069)
Extraordinary gains
207 100 (106)
Gains on disposal of fixed assets
2 100 98
Compensation for relocation
204
Extraordinary losses
275 143 (131)
Losses on disposal of fixed assets
100 32 (67)
Provision for reserves under special laws
175 111 (64)
Provision for reserve for price fluctuation
175 111 (64)
Income (loss) before income taxes
1,455 411 (1,044)
Income taxes - current
70 66 (3)
Income taxes - deferred
128 24 (103)
Total income taxes
198 91 (106)
Net income (loss)
1,257 320 (937)
Underwriting profit (loss)
(279) (337) (57)
Loss ratio (W/P basis)
71.0 % 65.8 % (5.2)%
Expense ratio (W/P basis)
33.6 33.1 (0.5)
Combined ratio (W/P basis)
104.7 98.9 (5.8)
Loss ratio (private sector, E/I basis)
73.8 68.9 (4.9)
Expense ratio (private sector)
34.6 34.1 (0.5)
Combined ratio (private sector)
108.4 103.0 (5.4)
14 Statement of income
SLIDE 17 Tokio Marine Holdings, Inc.
Reference : Nisshin Fire & Marine Insurance Co., Ltd. (non-consolidated)
Underwriting
Direct premiums written excluding deposit premiums from policyholders
(Yen in millions) Nine months ended December 31, 2018 ( April 1, 2018 to December 31, 2018 ) Nine months ended December 31, 2019 ( April 1, 2019 to December 31, 2019 ) Amount Composition ratio Rate of change Amount Composition ratio Rate of change
% % % %
Fire and allied lines
23,663 20.1 14.4 26,314 21.7 11.2
Hull and cargo
5,510 4.7 (6.1) 5,236 4.3 (5.0)
Voluntary automobile
64,004 54.5 (0.1) 64,503 53.2 0.8
Compulsory automobile liability
13,701 11.7 (3.8) 13,338 11.0 (2.7)
Others
10,551 9.0 15.5 11,878 9.8 12.6
Total
117,432 100.0 3.0 121,271 100.0 3.3
Deposit premiums from policyholders
1,328
1,140
Net premiums written
(Yen in millions) Nine months ended December 31, 2018 ( April 1, 2018 to December 31, 2018 ) Nine months ended December 31, 2019 ( April 1, 2019 to December 31, 2019 ) Amount Composition ratio Rate of change Amount Composition ratio Rate of change
% % % %
Fire and allied lines
16,351 15.0 14.2 19,039 16.8 16.4
Hull and cargo
0.0 (71.3) 0.0 (68.7)
Personal accident
5,460 5.0 (6.0) 5,189 4.6 (5.0)
Voluntary automobile
63,838 58.7 (0.2) 64,340 56.8 0.8
Compulsory automobile liability
12,980 11.9 (10.4) 13,066 11.5 0.7
Others
10,262 9.4 15.2 11,611 10.3 13.1
Total
108,894 100.0 1.3 113,246 100.0 4.0 Net claims paid
(Yen in millions) Nine months ended December 31, 2018 ( April 1, 2018 to December 31, 2018 ) Nine months ended December 31, 2019 ( April 1, 2019 to December 31, 2019 ) Amount Rate of change Loss ratio Amount Rate of change Loss ratio
% % % %
Fire and allied lines
20,550 142.8 128.5 16,980 (17.4) 91.4
Hull and cargo
1 (82.0) 841.5 1 0.9 1,328.8
Personal accident
2,679 (8.9) 55.2 2,439 (8.9) 52.9
Voluntary automobile
31,454 3.0 57.8 32,633 3.7 59.0
Compulsory automobile liability
10,440 (3.8) 87.4 9,373 (10.2) 78.5
Others
4,677 40.3 49.3 5,598 19.7 52.7
Total
69,803 24.3 71.0 67,026 (4.0) 65.8
(Note) Loss ratio is calculated on W/P basis.
15 Underwriting
SLIDE 18 Tokio Marine Holdings, Inc.
Reference : Nisshin Fire & Marine Insurance Co., Ltd. (non-consolidated)
Solvency margin ratio (non-consolidated)
(Yen in millions) As of March 31, 2019 As of December 31, 2019 (A) Total amount of solvency margin
155,193 152,238
Shareholders’ equity less adjusting items
48,241 48,561
Reserve for price fluctuation
1,516 1,627
Contingency reserve
60,962 57,312
General allowance for doubtful accounts
3 45
Unrealized gains (losses) on available-for-sale securities and deferred gains (losses)
- n hedge transactions before tax effect deductions
41,414 41,128
Unrealized gains (losses) on land
1,150 1,531
Excess of policyholders’ contract deposits
- Subordinated debt, etc.
- Amounts within "Excess of policyholders’ contract deposits" and
"Subordinated debt, etc." not calculated into the margin
1,903 2,030
(B) Total amount of risks
(R1+R2)2+(R3+R4)2+R5+R6
25,443 26,492
General insurance risk (R1)
12,807 12,981
Third sector insurance risk (R2)
- Assumed interest rate risk
(R3)
928 891
Asset management risk (R4)
12,488 12,137
Business administration risk (R5)
649 668
Catastrophe risk (R6)
6,245 7,431
(C) Solvency margin ratio [(A)/{(B)×1/2}]×100
1,219.9% 1,149.2%
(Note) Solvency margin ratio as of December 31, 2019 is calculated partially based on the data as of September 30, 2019.
16 Solvency margin ratio (non-consolidated)
SLIDE 19 Tokio Marine Holdings, Inc.
Reference : E.design Insurance Co., Ltd. (non-consolidated)
Balance sheet
(Yen in millions) As of March 31, 2019 As of December 31, 2019 Increase (Decrease) Amount Composition ratio Amount Composition ratio Assets
% %
Cash and bank deposits
45,384 90.25 43,400 88.31 (1,984)
Tangible fixed assets
93 0.19 195 0.40 101
Intangible fixed assets
0.00 0.00
4,809 9.56 5,548 11.29 738
Allowance for doubtful accounts
(0) (0.00) (0) (0.00)
Total assets
50,287 100.00 49,143 100.00 (1,143)
Liabilities Insurance liabilities
35,494 70.58 35,995 73.25 501
Outstanding claims
17,344 17,763 418
Underwriting reserves
18,150 18,232 82
Other liabilities
5,330 10.60 3,838 7.81 (1,491)
Income taxes payable
37 59 22
Lease obligations
12 79 66
Asset retirement obligations
50 48 (1)
Other liabilities
5,230 3,651 (1,579)
Provision for retirement benefits
215 0.43 254 0.52 38
Provision for employees’ bonus
177 0.35 58 0.12 (118)
Deferred tax liabilities
0.00 0.00 (0)
Total liabilities
41,218 81.97 40,147 81.69 (1,071)
Net assets Share capital
29,303 58.27 29,303 59.63
29,303 58.27 29,303 59.63
- Additional paid-in capital
29,303 29,303
(49,538) (98.51) (49,610) (100.95) (72)
Other retained earnings
(49,538) (49,610) (72)
Retained earnings carried forward
(49,538) (49,610) (72)
Total shareholders' equity
9,069 18.03 8,996 18.31 (72)
Total net assets
9,069 18.03 8,996 18.31 (72)
Total liabilities and net assets
50,287 100.00 49,143 100.00 (1,143)
17 Balance sheet
SLIDE 20 Tokio Marine Holdings, Inc.
Reference : E.design Insurance Co., Ltd. (non-consolidated)
Statement of income
(Yen in millions) Nine months ended December 31, 2018 ( April 1, 2018 to December 31, 2018 ) Nine months ended December 31, 2019 ( April 1, 2019 to December 31, 2019 ) Increase (Decrease) Ordinary income
22,204 23,342 1,138
Underwriting income
22,202 23,351 1,149
Net premiums written
22,190 23,336 1,146
Investment income on deposit premiums
11 14 2
Investment income
(9) (12) (2)
Interest and dividends
1 1
Transfer of investment income on deposit premiums
(11) (14) (2)
Other ordinary income
11 4 (7)
Ordinary expenses
25,378 23,360 (2,017)
Underwriting expenses
16,336 16,342 5
Net claims paid
12,900 13,975 1,075
Loss adjustment expenses
1,530 1,560 30
Agency commissions and brokerage
139 304 165
Provision for outstanding claims
1,266 418 (847)
Provision for underwriting reserves
499 82 (417)
Operating and general administrative expenses
6,168 7,015 846
Other ordinary expenses
2,872 2 (2,869)
Interest expenses
1
Amortization of deferred assets under Article 113 of the Insurance Business Act
2,870
Ordinary profit (loss)
(3,173) (17) 3,155
Extraordinary gains
4
Other extraordinary gains
4
Extraordinary losses
12 12
Losses on disposal of fixed assets
12 12
Income (loss) before income taxes
(3,173) (25) 3,147
Income taxes - current
9 47 37
Income taxes - deferred
(0) (0)
Total income taxes
8 46 37
Net income (loss)
(3,182) (72) 3,109
Underwriting profit (loss)
(303) (7) 296
Loss ratio (W/P basis)
65.0 % 66.6 % 1.5 %
Expense ratio (W/P basis)
28.4 31.4 2.9
Combined ratio (W/P basis)
93.5 97.9 4.5
Loss ratio (private sector, E/I basis)
72.7 68.9 (3.8)
Expense ratio (private sector)
28.7 31.8 3.1
Combined ratio (private sector)
101.5 100.7 (0.7)
18 Statement of income
SLIDE 21 Tokio Marine Holdings, Inc.
Reference : Tokio Marine & Nichido Life Insurance Co., Ltd. (non-consolidated)
Balance sheet
(Yen in millions) As of March 31, 2019 As of December 31, 2019 Increase (Decrease) Amount Composition ratio Amount Composition ratio Assets
% %
Cash and bank deposits
73,472 0.99 85,437 0.99 11,964
Call loans
0.00 1
Receivables under securities borrowing transactions
9,084 0.12 1,930 0.02 (7,154)
Monetary receivables bought
138,998 1.88
Securities
6,934,724 93.89 8,342,563 96.44 1,407,839
Domestic government bonds
6,112,210 7,312,971 1,200,761
Domestic municipal bonds
25,348 42,492 17,144
Domestic corporate bonds
243,058 382,875 139,817
Domestic equity securities
166 196 30
Foreign securities
434,898 478,785 43,887
Others
119,042 125,241 6,198
Loans
96,219 1.30 100,632 1.16 4,412
Policy loans
96,219 100,632 4,412
Tangible fixed assets
1,135 0.02 1,256 0.01 120
Intangible fixed assets
27 0.00 27 0.00
- Agency accounts receivable
478 0.01 269 0.00 (209)
Reinsurance accounts receivable
1,606 0.02 1,875 0.02 268
Other assets
131,031 1.77 117,565 1.36 (13,465)
Allowance for doubtful accounts
(821) (0.01) (718) (0.01) 102
Total assets
7,385,957 100.00 8,650,840 100.00 1,264,882
Liabilities Insurance liabilities
6,602,207 89.39 6,885,240 79.59 283,033
Outstanding claims
64,634 66,335 1,701
Underwriting reserves
6,446,824 6,737,222 290,397
Reserve for dividends to policyholders
90,748 81,682 (9,066)
Agency accounts payable
5,764 0.08 4,449 0.05 (1,314)
Reinsurance accounts payable
2,062 0.03 1,648 0.02 (413)
Other liabilities
349,269 4.73 1,308,626 15.13 959,356
Payables under securities lending transactions
197,623 1,152,859 955,235
Income taxes payable
4,132 4,325 192
Lease obligations
107 242 134
Other liabilities
147,404 151,198 3,793
Provision for retirement benefits
6,940 0.09 7,763 0.09 822
Reserves under special laws
10,080 0.14 12,421 0.14 2,341
Reserve for price fluctuation
10,080 12,421 2,341
Deferred tax liabilities
30,755 0.42 35,623 0.41 4,868
Total liabilities
7,007,080 94.87 8,255,774 95.43 1,248,693
Net assets Share capital
55,000 0.74 55,000 0.64
55,095 0.75 55,095 0.64
- Additional paid-in capital
41,860 41,860
13,235 13,235
47,749 0.65 50,614 0.59 2,864
Surplus reserve
13,140 13,140
34,609 37,474 2,864
Retained earnings carried forward
34,609 37,474 2,864
Total shareholders’ equity
157,845 2.14 160,709 1.86 2,864
Unrealized gains (losses) on available-for-sale securities
211,705 2.87 224,123 2.59 12,417
Deferred gains (losses) on hedge transactions
9,326 0.13 10,233 0.12 907
Total valuation and translation adjustments
221,031 2.99 234,356 2.71 13,324
Total net assets
378,876 5.13 395,066 4.57 16,189
Total liabilities and net assets
7,385,957 100.00 8,650,840 100.00 1,264,882
19 Balance sheet
SLIDE 22 Tokio Marine Holdings, Inc.
Reference : Tokio Marine & Nichido Life Insurance Co., Ltd. (non-consolidated)
Statement of income
(Yen in millions) Nine months ended December 31, 2018 ( April 1, 2018 to December 31, 2018 ) Nine months ended December 31, 2019 ( April 1, 2019 to December 31, 2019 ) Increase (Decrease) Ordinary income
726,581 723,196 (3,385)
Insurance premiums and other
647,825 627,792 (20,032)
Insurance premiums
641,867 622,220 (19,647)
Investment income
75,886 92,873 16,987
Interest and dividends
71,999 74,230 2,230
Gains on sales of securities
2,937 4,910 1,972
Gains on derivatives
869
Investment gains on separate accounts
13,597
Other ordinary income
2,869 2,529 (339)
Ordinary expenses
700,995 702,254 1,259
Insurance claims and other
342,136 299,237 (42,898)
Insurance claims
32,000 35,802 3,802
Annuity payments
46,855 46,135 (720)
Benefits
94,374 44,073 (50,301)
Surrender benefits
152,579 160,288 7,708
Other refunds
9,627 7,589 (2,037)
Provision for underwriting reserves and other
239,689 292,100 52,411
Provision for outstanding claims
5,810 1,701 (4,108)
Provision for underwriting reserves
233,878 290,397 56,519
Interest on reserve for dividends to policyholders
1 1
Investment expenses
24,892 12,624 (12,267)
Interest expenses
910 1,058 148
Losses on sales of securities
884 2 (882)
Losses on derivatives
7,710
Foreign exchange losses
7,983 3,851 (4,131)
Investment losses on separate accounts
15,112
Operating expenses
86,612 90,578 3,965
Other ordinary expenses
7,664 7,713 49
Ordinary profit (loss)
25,585 20,941 (4,644)
Extraordinary losses
1,703 2,348 644
Reversal of reserve for dividends to policyholders
2,669 6,658 3,989
Income (loss) before income taxes
26,551 25,252 (1,299)
Income taxes - current
5,884 7,601 1,716
Income taxes - deferred
1,722 (313) (2,035)
Total income taxes
7,606 7,287 (318)
Net income (loss)
18,944 17,964 (980)
20 Statement of income
SLIDE 23 Tokio Marine Holdings, Inc.
Reference : Tokio Marine & Nichido Life Insurance Co., Ltd. (non-consolidated)
Breakdown of ordinary profit (Core operating profit)
(Yen in millions) Nine months ended December 31, 2018 ( April 1, 2018 to December 31, 2018 ) Nine months ended December 31, 2019 ( April 1, 2019 to December 31, 2019 ) Increase (Decrease) Core operating profit (loss) A
32,368 29,537 (2,831)
Capital gains
2,937 5,121 2,184
Gains on sales of securities
2,937 4,910 1,972
Other capital gains
211
Capital losses
10,297 13,196 2,898
Losses on sales of securities
884 2 (882)
Losses on derivatives
614 9,306 8,691
Foreign exchange losses
7,983 3,851 (4,131)
Other capital losses
815 36 (779)
Net capital gains (losses) B
(7,360) (8,074) (714)
Core operating profit (loss) including net capital gains (losses) A+B
25,008 21,462 (3,545)
Non-recurring income
587 4 (583)
Reversal of contingency reserves
587
Decrease in specific allowance for doubtful accounts
4
Non-recurring losses
9 524 515
Provision for contingency reserves
524
Increase in specific allowance for doubtful accounts
9
Net non-recurring income (losses) C
577 (520) (1,098)
Ordinary profit (loss) A+B+C
25,585 20,941 (4,644)
21 Statement of income
SLIDE 24 Tokio Marine Holdings, Inc.
Reference : Tokio Marine & Nichido Life Insurance Co., Ltd. (non-consolidated)
Amount of policies
Policies in force (Number in thousands, yen in 100 millions) As of March 31, 2019 As of December 31, 2019 Number of policies Amount Number of policies Amount
% to March 31, 2018 % to March 31, 2018 % to March 31, 2019 % to March 31, 2019
Individual insurance
5,323 103.6 295,612 103.7 5,415 101.7 293,384 99.2
Individual annuities
532 93.8 22,837 91.9 516 96.9 21,875 95.8
Group insurance
95.1
98.9
Group annuities
98.6
98.3
New policies (Number in thousands, yen in 100 millions) Nine months ended December 31, 2018 ( April 1, 2018 to December 31, 2018 ) Nine months ended December 31, 2019 ( April 1, 2019 to December 31, 2019 ) Number of policies Amount Number of policies Amount
% to December 31, 2017 % to December 31, 2017 % to December 31, 2018 % to December 31, 2018
Individual insurance
319 98.0 25,400 99.4 278 87.3 15,032 59.2
Individual annuities
39.0
187.7
Group annuities
Policies in force (Yen in 100 millions) As of March 31, 2019 As of December 31, 2019 % to March 31, 2018 % to March 31, 2019 Individual insurance
7,089 102.6 6,977 98.4
Individual annuities
1,487 91.9 1,428 96.0
Total
8,577 100.6 8,405 98.0
Medical coverage, accelerated death benefits, etc.
1,916 108.1 2,002 104.5
Medical and cancer
1,636 107.9 1,709 104.4
New policies (Yen in 100 millions) Nine months ended December 31, 2018 ( April 1, 2018 to December 31, 2018 ) Nine months ended December 31, 2019 ( April 1, 2019 to December 31, 2019 ) % to December 31, 2017 % to December 31, 2018 Individual insurance
558 79.8 281 50.4
Individual annuities
558 79.8 281 50.4
Medical coverage, accelerated death benefits, etc.
170 104.2 159 93.7
Medical and cancer
142 104.6 131 92.7
22 Amount of policies
SLIDE 25 Tokio Marine Holdings, Inc.
Reference : Tokio Marine & Nichido Life Insurance Co., Ltd. (non-consolidated)
Solvency margin ratio (non-consolidated)
(Yen in millions) As of March 31, 2019 As of December 31, 2019 (A) Total amount of solvency margin
848,530 893,899
Shareholders’ equity less adjusting items
142,745 157,911
Reserve for price fluctuation
10,080 12,421
Contingency reserve
51,255 51,780
General allowance for doubtful accounts
462 371
(Unrealized gains (losses) on available-for-sale securities and deferred gains (losses)
- n hedge transactions before tax effect deductions) × 90%
264,631 280,153
Unrealized gains (losses) on land × 85%
- Excess of continued Zillmerized reserve
319,977 315,600
Subordinated debt, etc.
100,000 100,000
Amounts within "Excess of continued Zillmerized reserve" and "Subordinated debt, etc." not calculated into the margin
(132,053) (116,200)
Deductions
91,430 91,860
(B) Total amount of risks
(R1+R8)2+(R2+R3+R7)2+R4
82,235 102,800
Insurance risk (R1)
16,661 16,648
Third sector insurance risk (R8)
6,248 6,366
Assumed interest rate risk (R2)
5,059 5,104
Minimum guarantee risk (R7)
2,439 2,380
Asset management risk (R3)
69,400 90,227
Business administration risk (R4)
1,996 2,414
(C) Solvency margin ratio [(A)/{(B)×1/2}]×100
2,063.6% 1,739.0%
23 Solvency margin ratio (non-consolidated)
SLIDE 26 Tokio Marine Holdings, Inc.
Glossary of terminology
Underwriting profit = Underwriting income - (Underwriting expenses + Operating and general administrative expenses on underwriting) ± other miscellaneous income and expenses (*) * Mainly consist of income taxes related to compulsory automobile liability insurance.
Loss ratio (W/P basis) = (Net claims paid + Loss adjustment expenses) / Net premiums written × 100
- Expense ratio (W/P basis)
Expense ratio (W/P basis) = (Agency commissions and brokerage + Operating and general administrative expenses
- n underwriting) / Net premiums written × 100
- Combined ratio (W/P basis)
Combined ratio (W/P basis) = Loss ratio (W/P basis) + Expense ratio (W/P basis)
- Loss ratio (private sector (*1), E/I basis)
Loss ratio (private sector, E/I basis) = (Net claims paid + Outstanding claims as of the end of current period - Outstanding claims as of the end of previous fiscal year + Loss adjustment expenses) / Earned premiums (*2) × 100 *1 Excluding earthquake insurance under the Law concerning Earthquake Insurance and compulsory automobile liability insurance. *2 Earned premiums = Net premiums written - Unearned premiums as of the end of current period (*3) + Unearned premiums as of the end of previous fiscal year (*3) *3 Unearned premiums are premiums corresponding to the remaining duration of insurance policies at the end of the period.
- Expense ratio (private sector)
Expense ratio (private sector) = (Agency commissions and brokerage + Operating and general administrative expenses on underwriting) / Net premiums written × 100
- Combined ratio (private sector)
Combined ratio (private sector) = Loss ratio (private sector, E/I basis) + Expense ratio (private sector)
24 Glossary of terminology
SLIDE 27 Tokio Marine Holdings, Inc.
- Amount of Policies in force
- Individual insurance and group insurance
Total amount of death benefits under policies in force at the end of the period.
① Individual annuities whose payments have not yet commenced: amount of funds for annuity payments that is expected to have accrued at the commencement of annuity payments. ② Individual annuities whose payments have already commenced: amount of underwriting reserves.
Amount of underwriting reserves.
- Amount of New policies
- Individual insurance and group insurance
Total amount of death benefits under new policies issued during the current period.
Amount of funds for annuity payments that is expected to have accrued at the commencement of annuity payments for new policies issued during the current period.
First installment of premium payments.
Annualized premiums are amount of premiums per year calculated by dividing aggregate amount of premiums by the duration of insurance policies.
- Medical coverage, accelerated death benefits, etc.
Medical coverage, accelerated death benefits, etc. includes coverage for medical expenses (e.g. hospitalization and
- peration), accelerated death benefits (e.g. specific diseases and nursing care) and exemption of obligation to pay
insurance premiums excluding those caused by disability but including those caused by specific diseases, nursing care, etc.
- Solvency margin ratio
- In addition to reserves to cover claim payments, payments for maturity refunds of saving type insurance policies,
etc., it is necessary for insurance companies to maintain sufficient solvency in order to cover risks that exceed normal estimates, e.g. occurrences of a major catastrophe, a significant decline in value of assets held by insurance companies.
- (C) Solvency margin ratio is the ratio of (A) Total amount of solvency margin (i.e. solvency of insurance
companies in terms of their capital, reserves, etc.) to (B) Total amount of risks (i.e. risks that exceed normal estimates), which is calculated in accordance with the Insurance Business Act.
25 Glossary of terminology
SLIDE 28 Tokio Marine Holdings, Inc.
- "Risks that exceed normal estimates" is composed of risks described below.
① (General) insurance risk, third sector insurance risk: risk that insurance claims occur in excess of normal estimates excluding catastrophe risk. ② Assumed interest rate risk: risk that invested assets fail to yield assumed interest rates due to factors such as downturn of investment conditions. ③ Minimum guarantee risk: risk that value of assets related to the minimum guarantee for benefits of insurance contracts which are managed as a separate account fluctuates in excess of normal estimates and falls below the minimum guaranteed benefits when they are to be paid. ④ Asset management risk: risk that prices of retained securities and other assets fluctuate in excess of normal estimates. ⑤ Business administration risk: risk that occurs in excess of normal estimates and does not fall under other categories. ⑥ Catastrophe risk: risk that a major catastrophe in excess of normal estimates which is equivalent to the Great Kanto Earthquake or Isewan typhoon occurs.
- Solvency of insurance companies in terms of their capital, reserves, etc. ((A) Total amount of solvency margin) is
the total amount of net assets excluding planned outflows, certain reserves (e.g. reserve for price fluctuation, contingency reserve, catastrophe loss reserve, etc.) and part of unrealized gains on land, etc.
- Solvency margin ratio is one of the objective indicators used by the regulators to supervise insurance
- companies. A ratio exceeding 200% indicates sufficient solvency to fulfill payment obligations such as
insurance claims.
26 Glossary of terminology