
SLIDE 1
August 11, 2010
(URL: http://www.tokiomarinehd.com/) Representative: Contact: Scheduled date for filing the quarterly securities report (Shihanki Houkokusho) for the three months ended June 30, 2010: August 13, 2010
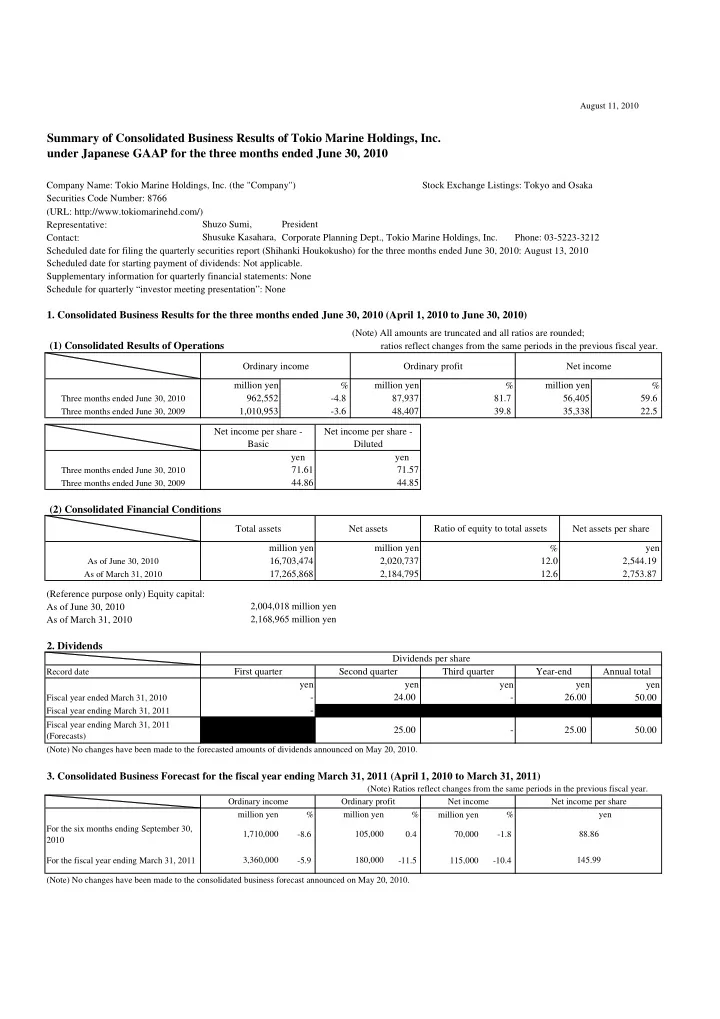
- 1. Consolidated Business Results for the three months ended June 30, 2010 (April 1, 2010 to June 30, 2010)
(1) Consolidated Results of Operations
Ordinary income Ordinary profit Net income % % %
Three months ended June 30, 2010 Three months ended June 30, 2009
Net income per share - Basic Net income per share - Diluted yen yen
Three months ended June 30, 2010 Three months ended June 30, 2009
(2) Consolidated Financial Conditions
Total assets Net assets Net assets per share %
As of June 30, 2010 As of March 31, 2010
(Reference purpose only) Equity capital: As of June 30, 2010 As of March 31, 2010
- 2. Dividends
Record date
yen yen
Fiscal year ended March 31, 2010 Fiscal year ending March 31, 2011 Fiscal year ending March 31, 2011 (Forecasts)
- 3. Consolidated Business Forecast for the fiscal year ending March 31, 2011 (April 1, 2010 to March 31, 2011)
(Note) Ratios reflect changes from the same periods in the previous fiscal year. % % million yen % For the six months ending September 30, 2010
- 8.6
0.4 70,000
- 1.8
For the fiscal year ending March 31, 2011
- 5.9
- 11.5
115,000
- 10.4
(Note) No changes have been made to the consolidated business forecast announced on May 20, 2010. 180,000
Schedule for quarterly “investor meeting presentation”: None Dividends per share 50.00 2,004,018 million yen
million yen
- million yen
yen Net income per share Ordinary profit Net income
- 25.00
yen yen 25.00
- 145.99
88.86 (Note) No changes have been made to the forecasted amounts of dividends announced on May 20, 2010.
50.00
Ordinary income 3,360,000
Shuzo Sumi, 44.86 71.57 President Supplementary information for quarterly financial statements: None 22.5 35,338
- Third quarter
24.00 yen
- 26.00
12.0 2,544.19 2,168,965 million yen First quarter Second quarter yen Year-end Annual total 12.6 2,753.87 17,265,868 2,020,737 Corporate Planning Dept., Tokio Marine Holdings, Inc. Phone: 03-5223-3212 Shusuke Kasahara, 48,407 1,010,953 59.6 56,405 Scheduled date for starting payment of dividends: Not applicable. 81.7
- 4.8
39.8 Company Name: Tokio Marine Holdings, Inc. (the "Company") Stock Exchange Listings: Tokyo and Osaka Securities Code Number: 8766 (Note) All amounts are truncated and all ratios are rounded; Ratio of equity to total assets 16,703,474 2,184,795 71.61 million yen 962,552 million yen 87,937 million yen million yen
Summary of Consolidated Business Results of Tokio Marine Holdings, Inc. under Japanese GAAP for the three months ended June 30, 2010
105,000 1,710,000
- 3.6