
SLIDE 1
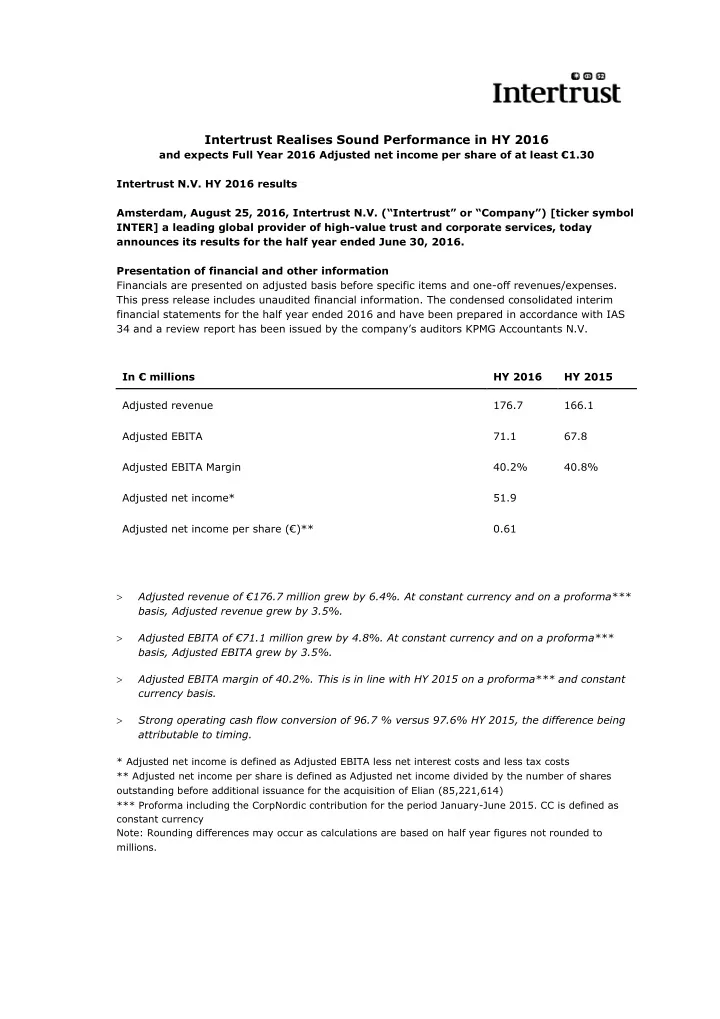
Intertrust Realises Sound Performance in HY 2016
and expects Full Year 2016 Adjusted net income per share of at least €1.30 Intertrust N.V. HY 2016 results Amsterdam, August 25, 2016, Intertrust N.V. (“Intertrust” or “Company”) [ticker symbol INTER] a leading global provider of high-value trust and corporate services, today announces its results for the half year ended June 30, 2016. Presentation of financial and other information Financials are presented on adjusted basis before specific items and one-off revenues/expenses. This press release includes unaudited financial information. The condensed consolidated interim financial statements for the half year ended 2016 and have been prepared in accordance with IAS 34 and a review report has been issued by the company’s auditors KPMG Accountants N.V. In € millions HY 2016 HY 2015 Adjusted revenue 176.7 166.1 Adjusted EBITA 71.1 67.8 Adjusted EBITA Margin 40.2% 40.8% Adjusted net income* 51.9 Adjusted net income per share (€)** 0.61 Adjusted revenue of €176.7 million grew by 6.4%. At constant currency and on a proforma*** basis, Adjusted revenue grew by 3.5%. Adjusted EBITA of €71.1 million grew by 4.8%. At constant currency and on a proforma*** basis, Adjusted EBITA grew by 3.5%. Adjusted EBITA margin of 40.2%. This is in line with HY 2015 on a proforma*** and constant currency basis. Strong operating cash flow conversion of 96.7 % versus 97.6% HY 2015, the difference being attributable to timing.
* Adjusted net income is defined as Adjusted EBITA less net interest costs and less tax costs ** Adjusted net income per share is defined as Adjusted net income divided by the number of shares
- utstanding before additional issuance for the acquisition of Elian (85,221,614)