Press release Intertrust N.V. Q2 and H1 2017 results Amsterdam 24 - - PDF document

press release
SMART_READER_LITE
LIVE PREVIEW

Press release Intertrust N.V. Q2 and H1 2017 results Amsterdam 24 - - PDF document

Press release Intertrust N.V. Q2 and H1 2017 results Amsterdam 24 August 2017 Intertrust N.V. (Intertrust or the Company) [ticker symbol INTER], a leading global provider of high-value trust, corporate and fund services, today


slide-1
SLIDE 1

Press release

Intertrust N.V. Q2 and H1 2017 results

Amsterdam – 24 August 2017 – Intertrust N.V. (“Intertrust” or the “Company”) [ticker symbol INTER], a leading global provider of high-value trust, corporate and fund services, today announces its results for the second quarter and half year ended 30 June 2017.

Intertrust fjnancial and operating performance for Q2 and H1 2017

  • Management reiterates full year 2017 guidance for underlying revenue of at least 3.5% year-on-year and for Adjusted

EBITA margin between 37.5-38.5%.

  • Revenue increased 33.0% year-on-year to EUR 118.1 million in Q2, but declined 0.1% on an underlying basis. Revenue

for H1 was EUR 239.7 million, implying underlying growth of 2.0%.

  • Adjusted EBITA was EUR 41.7 million in Q2, up 18.6% but down 9.0% underlying year-on-year. Adjusted EBITA margin

declined 342bps to 35.3% in Q2, primarily due to EUR 2.1 million of non-recurring expenses (or approx. 180bps).

  • Elian synergy realisation continues on track; the IT integration is now expected to be completed in 2019.
  • Adjusted net income in H1 2017 grew 24.1% to EUR 64.5 million. Adjusted EPS in H1 2017 was EUR 0.71, up 15.9%

year-on-year.

  • An interim dividend of EUR 0.28 per share has been declared and will be paid on 29 November 2017.
  • Management and Supervisory Board changes are announced in separate press releases also published today.

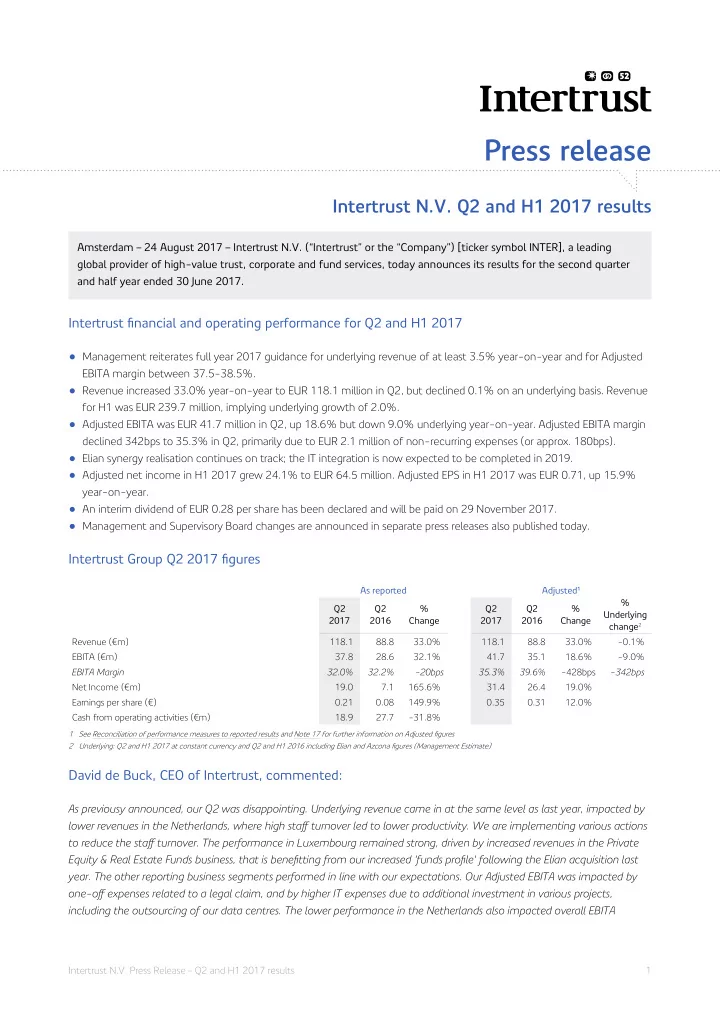
Intertrust Group Q2 2017 fjgures

As reported Adjusted1 Q2 2017 Q2 2016 % Change Q2 2017 Q2 2016 % Change % Underlying change2 Revenue (€m) 118.1 88.8 33.0% 118.1 88.8 33.0%

  • 0.1%

EBITA (€m) 37.8 28.6 32.1% 41.7 35.1 18.6%

  • 9.0%

EBITA Margin 32.0% 32.2%

  • 20bps

35.3% 39.6%

  • 428bps
  • 342bps

Net Income (€m) 19.0 7.1 165.6% 31.4 26.4 19.0% Earnings per share (€) 0.21 0.08 149.9% 0.35 0.31 12.0% Cash from operating activities (€m) 18.9 27.7

  • 31.8%

1 See Reconciliation of performance measures to reported results and Note 17 for further information on Adjusted fjgures 2 Underlying: Q2 and H1 2017 at constant currency and Q2 and H1 2016 including Elian and Azcona fjgures (Management Estimate)

David de Buck, CEO of Intertrust, commented:

As previousy announced, our Q2 was disappointing. Underlying revenue came in at the same level as last year, impacted by lower revenues in the Netherlands, where high stafg turnover led to lower productivity. We are implementing various actions to reduce the stafg turnover. The performance in Luxembourg remained strong, driven by increased revenues in the Private Equity & Real Estate Funds business, that is benefjtting from our increased 'funds profjle' following the Elian acquisition last

  • year. The other reporting business segments performed in line with our expectations. Our Adjusted EBITA was impacted by
  • ne-ofg expenses related to a legal claim, and by higher IT expenses due to additional investment in various projects,

including the outsourcing of our data centres. The lower performance in the Netherlands also impacted overall EBITA

1 Intertrust N.V. Press Release – Q2 and H1 2017 results

slide-2
SLIDE 2

margins for Q2 and H1. The integration of Elian remains on track and we are seeing integration synergies in line with our business case, although the full systems integration will take until mid-2019 to complete.

Intertrust Group H1 2017 fjgures

As reported Adjusted1 H1 2017 H1 2016 % Change H1 2017 H1 2016 % Change % Underlying change2 Revenue (€m) 239.7 176.7 35.7% 239.7 176.7 35.7% 2.0% EBITA (€m) 82.5 62.9 31.1% 87.8 71.1 23.5%

  • 4.1%

EBITA Margin 34.4% 35.6%

  • 120bps

36.6% 40.2%

  • 360bps
  • 232bps

Net Income (€m) 39.8 23.0 72.6% 64.5 51.9 24.1% Earnings per share (€) 0.44 0.27 62.3% 0.71 0.61 15.9% Cash from operating activities (€m) 84.8 82.3 3.1%

1 See Reconciliation of performance measures to reported results and Note 17 for further information on Adjusted fjgures 2 Underlying: Q2 and H1 2017 at constant currency and Q2 and H1 2016 including Elian and Azcona fjgures (Management Estimate)

Intertrust Group KPIs

Q2 2017 Q2 2016 % Change % Change (CC) % Underlying change1 H1 2017 H1 2016 % Change % Change (CC) % Underlying change1 Revenue (€m) 118.1 88.8 33.0% 35.0%

  • 0.1%

239.7 176.7 35.7% 37.9% 2.0% Adjusted EBITA (€m)2 41.7 35.1 18.6% 20.3%

  • 9.0%

87.8 71.1 23.5% 25.3%

  • 4.1%

Average number of FTEs 2,418 1,716 40.9% Number of entities (000's, end of period) 50.5 38.6 30.9% ARPE (annualised) 9.5 9.2 3.6% Revenue/FTE (annualised) 198.2 205.9

  • 3.7%
  • Adj. EBITA/FTE (annualised)

72.6 82.9

  • 12.4%

1 Underlying: Q2 and H1 2017 at constant currency and Q2 and H1 2016 including Elian and Azcona fjgures (Management Estimate) 2 See Reconciliation of performance measures to reported results and Note 17 for further information on Adjusted fjgures

Additional highlights Q2/H1 2017

  • Revenue in the Netherlands was EUR 27.6 million or an underlying decline of 8.0% for Q2 and EUR 56.6 million for H1
  • r an underlying decline of 3.5% year-on-year. This decline is primarily attributable to lower productivity due to stafg

turnover in the Netherlands as well as some softening of the market.

  • Luxembourg revenue grew by 11.2% underlying to EUR 23.5 million in Q2 and by 14.7% underlying year-on-year to

EUR 47.6 million for H1 2017. Management believes the strong growth in Luxembourg is a result of market growth as well as increasing market share.

  • The realisation of Elian-related synergies continues on track. Performance in Jersey has been in line with expectations,

with Q2 revenue of EUR 15.1 million or 3.7% underlying growth year-on-year and EBITA contribution of EUR 7.9 million..

  • Gross infmow of entities during Q2 was 1,570, while gross outfmow was 2,096. Normalising for outfmow of 676 entities

related to defjnition harmonisation1 adjustments, net infmow would have been 150 entities. End-of-life continues to account for more than half of all outfmow and competitive losses in Q2 again represented less than 10% of gross outfmow globally.

  • Average Revenue per entity ("ARPE") in H1 increased 3.6% year-on-year to EUR 9.5 thousand, primarily driven by

additional reporting requirements and a mix efgect.

1 Harmonisation adjustments related mainly to the defjnition of (former Elian) entities, where entities with a low ARPE (GBP 400-600) and

a low risk profjle were excluded. 2 Intertrust N.V. Press Release – Q2 and H1 2017 results

slide-3
SLIDE 3
  • Approximately half of the adjusted EBITA margin decline of 232bps in H1 was due to non-recurring items of

EUR 2.9 million (121bps) and the remainder due to increased HQ & IT costs and the Netherlands underperformance. Non-recurring items consisted primarily of a legal claim and related legal fees.

  • In H1, interest costs were EUR 13.7 million included in the total Financial results of EUR 12.8 million. Tax expenses were

EUR 9.1 million, implying an efgective tax rate of 18.7% for H1 2017 (15.9% on adjusted basis2).

  • Cash from operating activities was EUR 84.8 million for H1 2017, impacted by trade working capital changes and timing
  • difgerences. The cash conversion ratio3 for H1 2017 was 96.6%.
  • Capex4 for H1 2017 amounted to EUR 2.4 million (1.0% of revenue) versus EUR 3.9 million (2.2% of revenue) in H1

2016.

  • Between 22 March 2017 and 11 May 2017 a total of 1,856,354 shares were repurchased, at an average price of

EUR 18.26 per share, to cover a deferred obligation to transfer shares towards certain employees including the selling shareholders within the former management team of Elian.

  • Net debt increased to EUR 741.0 million at the end of Q2 2017 (from EUR 706.3 million at end of Q1 2017). The

leverage ratio increased from 3.50x (end Q1 2017) to 3.81x (end Q2 2017) as cash was used to buy back shares (EUR 32.3 million) and pay out the fjnal dividend of EUR 0.25 for FY 2016 (EUR 20.0 million).

Outlook

During our preliminary Q2 results on 25 July 2017, revised guidance was announced for full year 2017 revenue and EBITA

  • margins. Other guidance pertaining to full year 2017, as given at the time of the Q1 2017 results, are reiterated.
  • Underlying5 revenue growth guidance for full year 2017 of at least 3.5% year-on-year.
  • Adjusted EBITA margin guidance for the full year 2017 of 37.5-38.5%.
  • Dividend policy continues to be distribution of 40-50% of adjusted net income.
  • Guidance on synergies (GBP 10.4 million by the end of CY 2018E, of which 75% by end CY 2017E), capex (less than

2% of revenue), tax rate (18% efgective tax rate, 16% on adjusted basis2), and cash conversion (in line with historical rates) remains unchanged. Intertrust is suspending its M&A activities while we prioritise the integration of Elian in the near-term. The company is reviewing capital allocation and will communicate the outcome in due course. The Capital Markets Day originally planned for 21 September 2017 has been postponed.

2 Tax expenses adjusted for specifjc tax expense items. 3 Cash conversion ratio is defjned as operating free cash fmow divided by Adjusted EBITDA and is expressed as a percentage. 4 Investments in property, plant, equipment and software not related to acquisitions. 5 Underlying: 2017 at constant currency and 2016 including Elian and Azcona fjgures (Management Estimate)

3 Intertrust N.V. Press Release – Q2 and H1 2017 results

slide-4
SLIDE 4

Performance in key jurisdictions

The Netherlands

The Netherlands Q2 2017 Q2 2016 % Change % Underlying change1 H1 2017 H1 2016 % Change % Underlying change1 Revenue (€m) 27.6 29.7

  • 7.3%
  • 8.0%

56.6 58.3

  • 2.9%
  • 3.5%

Adjusted EBITA (€m) 16.8 19.3

  • 12.8%
  • 13.0%

35.2 37.4

  • 5.7%
  • 5.6%

Adjusted EBITA margin 60.9% 64.8%

  • 385bps

62.2% 64.1%

  • 185bps

Average number of FTEs 437 431 1.2% Number of entities (000's, end of period) 4.1 4.3

  • 4.9%

ARPE (€k, annualised) 27.6 27.0 2.2% Revenue/FTE (€k, annualised) 259.5 270.3

  • 4.0%
  • Adj. EBITA/FTE (€k, annualised)

161.5 173.2

  • 6.8%

1 Underlying: Q2 and H1 2017 at constant currency and Q2 and H1 2016 including Elian fjgures (Management Estimate)

The Netherlands continues to be an attractive market because of its strong business climate and extensive network of tax

  • treaties. However, the total number of entities in the Netherlands market has decreased as a result of a slightly lower level
  • f new incorporations combined with a higher level of liquidations. Moderate market growth over the short/medium-term

is expected, driven by demand for increasingly complex compliance and regulatory services. Intertrust Netherlands' Q2 revenue declined 7.3% year-on-year or 8.0% on an underlying basis. The decrease in underlying revenue of EUR 2.4 million was driven by elevated entity outfmow (EUR 0.9 million impact), lower productivity as a result of higher stafg turnover (EUR 0.9 million impact) and the timing efgect of hours written on fjxed fee clients (EUR 0.8 million impact), partially compensated by a higher hourly price efgect. The outfmow of entities was elevated but reasons for outfmow were similar to previous periods, being mainly end-of-life, compliance and insourcing. Stafg turnover consisted of 36 leavers in Q2 versus 22 in Q2 2016. The main reasons cited for increased stafg turnover were career development, compensation and career change. Concrete actions were taken to reduce stafg turnover, including an independent benchmarking survey which resulted in modest increases to the salary framework, ongoing improvements to the physical work environment and increased focus on career development trajectories. A number of cultural initiatives were undertaken at a local level including measures to strengthen the employer brand, such as the renewal of the careers website and CSR activities focusing on increasing employee engagement. As these measures will not have an immediate efgect, stafg turnover levels are expected to remain elevated in Q3 and then normalise thereafter. In order to secure client service levels in the meantime, temporary stafg has been hired. Efgorts to recruit permanent stafg have been stepped-up. Adjusted EBITA in Q2 declined 12.8% year-on-year and 13.0% on an underlying basis, mainly driven by the revenue

  • decline. Higher costs are expected as a result of increased recruitment costs and temporary stafg, implying increased costs

for the second half until stafg turnover has normalised. Operational performance in the Netherlands is expected to improve in the latter part of the year. Full year 2017 revenue is expected to be in line with 2016 revenue. Recent management changes in the Netherlands included the promotion of internal managers to senior commercial roles following the retirement of one senior manager.

4 Intertrust N.V. Press Release – Q2 and H1 2017 results

slide-5
SLIDE 5

Luxembourg

Luxembourg Q2 2017 Q2 2016 % Change % Underlying change1 H1 2017 H1 2016 % Change % Underlying change1 Revenue (€m) 23.5 19.7 19.4% 11.2% 47.6 38.5 23.5% 14.7% Adjusted EBITA (€m) 11.9 10.2 17.3% 14.4% 25.4 19.8 28.0% 26.8% Adjusted EBITA margin 50.7% 51.6%

  • 93bps

53.3% 51.5% 186bps Average number of FTEs 442 363 21.6% Number of entities (000's, end of period) 3.0 2.6 13.1% ARPE (€k, annualised) 32.2 29.5 9.2% Revenue/FTE (€k, annualised) 215.7 212.3 1.6%

  • Adj. EBITA/FTE (€k, annualised)

115.0 109.3 5.3%

1 Underlying: Q2 and H1 2017 at constant currency and Q2 and H1 2016 including Elian fjgures (Management Estimate)

In Luxembourg in Q2, revenue increased 19.4% year-on-year or 11.2% on an underlying basis, driven by an increase of billable stafg as well as an increase in the hourly rate and hours spent on client entities due to increasing activities. Strong growth in the funds service line on the back of continued Private Equity & Real Estate activities reaffjrmed Luxembourg's attractiveness as a leading fund jurisdiction. ARPE growth of 9.2% year-on-year in H1 was driven by increased regulation and compliance, increased transaction level and complexity per client entity, and increased reporting (FATCA/CRS/UBO register). Underlying adjusted EBITA growth of 14.4% in Q2 and 26.8% year-on-year in H1 2017, mainly driven by revenue growth while maintaining cost control. H1 2017 adjusted EBITA margin increased 186bps year-on-year to 53.3%. The number of entities increased year-on-year due to the Elian acquisition. Compared with Q1 2017, the number of entities remained fmat during Q2 if corrected for a defjnition harmonisation which impacted 132 entities. Luxembourg's successful recruitment strategy continued to result in strong infmow of skilled professional stafg, while at the same time stafg outfmow remained well under control, further strengthening Intertrust Luxembourg's position as an employer of choice in the market. Cayman Islands

Cayman Islands Q2 2017 Q2 2016 % Change % Change (Constant Currency) % Underlying change1 H1 2017 H1 2016 % Change % Change (Constant Currency) % Underlying change1 Revenue (€m) 16.6 12.4 34.5% 31.1%

  • 2.2%

34.1 25.7 32.8% 28.9%

  • 2.2%

Adjusted EBITA (€m) 9.4 6.8 39.4% 35.9% 7.6% 19.3 14.8 30.5% 26.6% 4.2% Adjusted EBITA margin 56.6% 54.6% 199bps 56.4% 57.5% -102bps Average number of FTEs 184 134 37.4% Number of entities (000's, end of period) 19.5 15.9 22.9% ARPE (€k, annualised) 3.5 3.2 8.1% 4.9% Revenue/FTE (€k, annualised) 370.2 382.9

  • 3.3%
  • 6.2%
  • Adj. EBITA/FTE (€k, annualised)

208.9 220.0

  • 5.0%
  • 7.8%

1 Underlying: Q2 and H1 2017 at constant currency and Q2 and H1 2016 including Elian fjgures (Management Estimate)

In Cayman Islands, Q2 and H1 revenue increased over 30% year-on-year, but declined 2.2% on an underlying basis. Entity count at the end of H1 increased 22.9% year-on-year, but declined on an underlying basis due to the competitive market

  • environment. Increased client demand for FATCA/CRS reporting as well as specialised services including risk management,

compliance and fund administration & accounting, partly compensated the decline in registered offjce engagements. H1 ARPE grew 4.9% at constant currency, infmuenced largely by the growth in value add services and the loss of lower value registered offjce-only client entities.

5 Intertrust N.V. Press Release – Q2 and H1 2017 results

slide-6
SLIDE 6

Entity outfmows to competitors have decreased and are back at normal levels. Management expects revenue growth in the second half of 2017 to benefjt from comparison to the lower revenue base in H2 2016. Jersey

Jersey Q2 2017 Q2 2016 % Change % Underlying change1 H1 2017 H1 2016 % Change % Underlying change1 Revenue (€m) 15.1 n.a.2 n.a. 3.7% 29.7 n.a. n.a. 3.7% Adjusted EBITA (€m) 7.9 n.a. n.a. n.a. 14.9 n.a. n.a. n.a. Adjusted EBITA margin 52.3% n.a. n.a. 50.3% n.a. n.a. Average number of FTEs 344 n.a. n.a. Number of entities (000's, end of period) 4.4 n.a. n.a. ARPE (€k, annualised) 13.5 n.a. n.a. Revenue/FTE (€k, annualised) 172.6 n.a. n.a.

  • Adj. EBITA/FTE (€k, annualised)

86.8 n.a. n.a.

1 Underlying: Q2 and H1 2017 at constant currency and Q2 and H1 2016 including Elian fjgures (Management Estimate) 2 n.a.: no reported results available as Intertrust had no operations in Jersey in Q2/H1 2016

Jersey continued to perform in line with expectations. In Q2, Jersey revenue grew 3.7% year-on-year on an underlying basis, driven by strong performances in the funds service line, but also complemented by additional revenue generated in all service lines by assisting clients to comply with legal and regulatory changes. We see sequential adjusted EBITA margin improvement in Jersey, from 48.2% in Q1 to 52.3% in Q2, supported by revenue growth and lower costs. Compared with Q1, the number of entities in Jersey remained essentially fmat when adjusted for an outfmow of 147 entities due to the defjnition harmonisation. Management reiterates its expectation that accelerated growth in the second half will result in high-single digit growth for full year 2017. Rest of the World (ROW)

Rest of the World Q2 2017 Q2 2016 % Change % Change (Constant Currency) % Underlying change1 H1 2017 H1 2016 % Change % Change (Constant Currency) % Underlying change1 Revenue (€m) 35.3 27.0 30.7% 33.8%

  • 1.0%

71.6 54.1 32.3% 35.7% 0.4% Adjusted EBITA (€m) 11.4 9.3 23.7% 26.4%

  • 8.0%

24.9 18.9 31.7% 35.3%

  • 2.1%

Adjusted EBITA margin 32.4% 34.3% -184bps 34.8% 35.0%

  • 16bps

Average number of FTEs 834 649 28.5% Number of entities (000's, end of period) 19.5 15.7 24.0% ARPE (€k, annualised) 7.3 6.9 6.7% 9.4% Revenue/FTE (€k, annualised) 171.8 166.9 3.0% 5.6%

  • Adj. EBITA/FTE (€k, annualised)

59.8 58.3 2.5% 5.3%

1 Underlying: Q2 and H1 2017 at constant currency and Q2 and H1 2016 including Elian and Azcona fjgures (Management Estimate)

In Rest of the World (ROW), Q2 revenue grew 30.7% year-on-year but declined 1.0% on an underlying basis, driven by the lower performance of mainly Switzerland and Belgium, which could not be ofgset by growth in Ireland, Singapore and

  • Spain. Growth in ROW continues to be driven by a modest recovery in FDI fmows, increase in M&A appetite, ongoing Private

Equity/Real Estate fundraising and preference of clients to comply with additional reporting requirements.

6 Intertrust N.V. Press Release – Q2 and H1 2017 results

slide-7
SLIDE 7

Our UK, Irish and Spanish offjces increasingly benefjt from a growth in capital market transactions due to regained investor

  • confjdence. The Azcona integration is on track and performing in line with our business case.

Adjusted EBITA and margins declined in Q2 and H1, impacted predominantly by the legal claim and related fees recognised in this segment. Without the non-recurring expenses, H1 adjusted EBITA margin would have been 37.6%, an increase of 263bps year-on-year. ARPE increased to EUR 7.3 thousand in H1 2017, a 9.4% increase year-on-year at constant currency. The addition of the Elian entities and more complex services contributed to the ARPE increase. In the second half of 2017, ROW is expected to show improved revenue growth compared to H1 2017. Group HQ & IT costs

Group HQ and IT Q2 20171 Q2 2016 H1 20171 H1 2016 Group HQ and IT costs (€m)

  • 15.8
  • 10.3
  • 31.9
  • 19.8

1 Q2/H1 2017 fjgures include Elian

In the fjrst half of 2017, Group HQ and IT costs increased by EUR 12.1 million. This increase includes EUR 5.9 million (net of synergies) related to the inclusion of Elian and EUR 0.6 million from non-recurring items6. Overall the Group HQ and IT costs in Q2 were at a similar level as Q1. More specifjcally in HQ and in addition to the amounts mentioned above, we see an increase in H1 related to higher Long- Term Incentive Plan (LTIP) and bonus related spend (EUR 1.6 million), higher marketing expenses, professional fees and

  • ther expenses (EUR 0.7 million), and higher stafg costs (EUR 0.8 million7) related to the strengthening of Group Functions,

amongst others Business Operations and Group Finance. IT costs in H1 increased due to higher IT depreciation following the completion of IT investments in 2016 (EUR 0.6 million), higher operating expenses related to the migration of data centres (EUR 0.6 million), increased outsourcing costs (EUR 1.0 million) and higher stafg costs (EUR 0.3 million7). Migration of our data centres to outsourced solutions will continue until early 2019, and is expected to increase the scalability and resilience of our IT infrastructure. At the same time, IT capital expenditures have reduced structurally due to the migration to Infrastructure as a Service (IaaS) and Software as a Service (SaaS). During H1 2017 we have executed an IT assessment, which is important input to our short-term IT priorities and IT

  • roadmap. We are currently fjnalising the IT roadmap and the accompanying fjnancial plan.

For the second half of 2017, we expect Group HQ and IT costs to remain constant and in line with the fjrst half.

6 EUR 0.6 million of non-recurring items related to Group HQ & IT costs form part of the total non-recurring items of EUR 2.9 million. 7 Net of a shift in operations resources from IT to HQ in 2017.

7 Intertrust N.V. Press Release – Q2 and H1 2017 results

slide-8
SLIDE 8

Reconciliation of performance measures to reported results

(EUR 000) Q2 H1 2017 2016 2017 2016 Unaudited Unaudited Unaudited Unaudited Profjt/(loss) from operating activities 27,312 21,094 61,914 47,847 Amortisation of acquisition-related intangible assets 10,493 7,519 20,621 15,101 Specifjc items - Transaction & Monitoring costs (10) 4,561 83 4,561 Specifjc items - Integration costs 2,783 228 3,135 757 Specifjc items - Share-based payment upon IPO 629 1,408 1,109 2,447 Specifjc items - Share-based payment upon integration 428

  • 832
  • Specifjc items - Other operating (income)/expenses

44 (116) 147 (113) One-ofg expenses

  • 451
  • 507

Adjusted EBITA1 41,679 35,143 87,841 71,106

1 Adjusted EBITA is defjned as EBITA before specifjc items. Specifjc items of income or expense are income and expense items that, based on their signifjcance in size or nature, should be separately presented to provide further understanding on fjnancial performance. Specifjc items are not of an operational nature and do not represent core operating results. The

  • ne-ofg expenses are related to redundancies, legal costs and settlement fees. The Company uses this measure to analyse the operational performance of the company and its

reportable segments.

(EUR 000) H1 2017 Adjusted Specifjc items Excluded items Reported EBITA 87,841 (5,306)

  • 82,535

Amortisation of acquisition-related intangible assets

  • (20,621)

(20,621) Profjt/(loss) from operating activities 87,841 (5,306) (20,621) 61,914 Net fjnance costs - excluding net foreign exchange loss (14,052)

  • (14,052)

Foreign exchange gains

  • 1,234

1,234 Share of profjt of equity-accounted investees (net of tax) (195)

  • (195)

Profjt/(loss) before income tax 73,594 (5,306) (19,387) 48,901 Income tax (9,138)

  • (9,138)

Net income1 64,456 (5,306) (19,387) 39,763 (EUR 000) H1 2016 Adjusted Specifjc items Excluded items Reported EBITA 71,106 (8,158)

  • 62,948

Amortisation

  • (15,101)

(15,101) Profjt/(loss) from operating activities 71,106 (8,158) (15,101) 47,847 Net fjnance costs - excluding net foreign exchange loss (9,300)

  • (9,300)

Foreign exchange losses

  • (5,615)

(5,615) Share of profjt of equity-accounted investees (net of tax) (11)

  • (11)

Profjt/(loss) before income tax 61,795 (8,158) (20,716) 32,921 Income tax (9,881)

  • (9,881)

Net income1 51,914 (8,158) (20,716) 23,040

1 Adjusted net income is defjned as Adjusted EBITA less net fjnance cost and less income tax. The Company uses this measure a.o. in its dividend policy

8 Intertrust N.V. Press Release – Q2 and H1 2017 results

slide-9
SLIDE 9

Additional information

Intertrust N.V Financial Calendar

Date Event 17 October 2017 Extraordinary General Meeting 1 November 2017 Interim ex-dividend date 2 November 2017 Interim dividend record date 9 November 2017 Publication of Q3 2017 trading update 29 November 2017 Interim dividend payment date 8 February 2018 Publication of Q4 and Full Year 2017 unaudited results 17 May 2018 Annual General Meeting

Press and analyst calls Today, Intertrust CEO David de Buck and CFO Maarten de Vries will hold an:

  • Analyst / investor call at 09:30 CET. A webcast of the call will be available on the Company's website. The webcast can

be accessed here

  • The supporting presentation can be downloaded from our website

For further information

Intertrust N.V. Anne Louise Metz AnneLouise.Metz@intertrustgroup.com Director of Investor Relations, Marketing & Communications Tel: +31 20 577 1157

About Intertrust Intertrust is a leading global provider of high-value trust, corporate and fund services, with approximately 2,500 employees located throughout a network of 41 offjces in 30 jurisdictions across Europe, the Americas, Asia and the Middle-East. The Company delivers high-quality, tailored services to its clients with a view to building long-term relationships. Intertrust’s business services ofgering is comprised of corporate services, fund services, capital market services, and private wealth

  • services. Intertrust has leading market positions in selected key geographic markets of its industry, including the

Netherlands, Luxembourg, Jersey and the Cayman Islands. Intertrust works with global law fjrms and accountancy fjrms, multi-national corporations, fjnancial institutions, fund managers, high net worth individuals and family offjces.

9 Intertrust N.V. Press Release – Q2 and H1 2017 results

slide-10
SLIDE 10

Intertrust Group Interim Financial Report 30 June 2017 (Unaudited)

Condensed consolidated interim fjnancial statements for the six month period ended 30 June 2017 Semi-annual fjnancial report 11 Condensed consolidated interim statement of profjt or loss 14 Condensed consolidated interim statement of comprehensive income 14 Condensed consolidated interim statement of fjnancial position 15 Condensed consolidated interim statement of changes in equity 16 Condensed consolidated interim statement of cash fmows 17 Notes to the condensed consolidated interim fjnancial statements 18 1. Reporting entity 18 2. Basis of preparation 18 3. Signifjcant accounting policies and standards 18 4. Use of estimates and judgements 19 5. Operating segments 19 6. Stafg expenses 20 7. Earnings per share 21 8. Acquisition-related intangible assets 21 9. Business combinations 22

  • 10. Capital and reserves

22

  • 11. Financial instruments

23

  • 12. Cash fmow hedges

24

  • 13. Contingencies

24

  • 14. Commitments

25

  • 15. Related parties

25

  • 16. Subsequent events

25

  • 17. Non-IFRS Financial measures

25 Review report 26

10 Intertrust N.V. Press Release – Q2 and H1 2017 results

slide-11
SLIDE 11

Semi-annual fjnancial report

Introduction Intertrust N.V. (the "Company") and its subsidiaries (together referred to as the "Group") is the leading global provider of high-value trust, corporate and fund services. The Company has more than 2,400 FTEs working in its offjces across all continents. Market and Intertrust outlook 2017 Revised guidance was announced on 25 July for full year 2017 revenue and EBITA margins. Other guidance pertaining to full year 2017 as given at the time of the Q1 2017 results are reiterated. The full year 2017 outlook includes:

  • Underlying revenue growth of at least 3.5% year-on-year.
  • Adjusted EBITDA margin of 37.5%-38.5%.
  • Unchanged outlook on:
  • Dividend policy at 40-50% of adjusted net income,
  • Realisation of 75% of announced synergies by year end 2017,
  • Capex less than 2% of revenue,
  • Efgective tax rate of 18%, 16% on adjusted basis, and
  • Cash conversion in line with historical rates.

Financial review for the six-month period ended 30 June 2017 In the fjrst half of 2017, the Group generated revenue of EUR 239.7 million, which is EUR 63.0 million higher compared with EUR 176.7 million in the same period of 2016. EBITA margin was 34.4% for fjrst half year of 2017, impacted mainly by non-recurring items of EUR 2.9 million, primarily related to a legal claim and related legal fees. Revenue Revenue increased by EUR 63.0 million, or 35.7%, year-on-year to EUR 239.7 million for the six months ended 30 June

  • 2017. The increase in revenue was driven by Elian acquistion in 2016 and growth in Luxemburg mainly due to time-based

fees following the increase in billable FTEs and higher fjxed fees. This good performance was ofgset by a lower than expected revenue performance in the Netherlands, resulting from lower productivity due to higher stafg turnover and less favourable market conditions. Other than this lower performance the revenue on normalised level was lower on year-on-year comparison due to a negative impact of exchange rate variances mostly arising from GBP exchange rate fmuctuation. Stafg expenses Salaries and wages increased by EUR 23.3 million year-on-year, or 38.5% to EUR 83.6 million for H1 2017. Other than the salaries, stafg expenses in the fjrst half of 2017 comprised EUR 1.9 million of equity-settled share-based payments upon the 2015 IPO and integration, presented in Specifjc items in Intertrust’s adjusted results, and also EUR 1.7 million other equity- settled share-based payments. On a constant currency basis, stafg expenses increased by EUR 31.9 million or 41.4%. This increase was primarily driven by the inclusion of Elian in half year 2017 causing increase in both billable and non-billable FTE numbers. Rental and other operating expenses Rental expenses increased by EUR 3.0 million year-on-year, or 33.0%, to EUR 12.0 million for H1 2017. On a constant currency basis, Rental expenses increased by 34.3%. This increase was mainly driven by the consolidation of the Elian entities on a half year basis.

11 Intertrust N.V. Press Release – Q2 and H1 2017 results

slide-12
SLIDE 12

Depreciation and amortisation Depreciation and Amortisation charges increased by EUR 6.9 million year-on-year, or 36.3%, to EUR 26.1 million for the six months ended 30 June 2017. The EUR 26.1 million for half year 2017 includes amortisation of brand and amortisation of intangibles of EUR 20.6 million and depreciation and software amortisation of EUR 5.4 million. The increase of EUR 1.2 million in Depreciation was mainly due to higher capital expenditure relating to the integration of Elian entities, as well as the capitalisation and completion of IT investments in 2016. Operating result As a result of the aforementioned factors and mostly due to the Elian acquistion, the Profjt from operating activities increased by EUR 14.1 million year-on-year, or 29.4%, to EUR 61.9 million for half year 2017. Financial result The fjnancial result decreased by EUR 2.1 million year-on-year or 14.1%, to EUR 12.8 million for half year 2017. This decrease is mainly due to favourable exchange gains, ofgset by higher bank interests due to new loan facilities. The fjnancial result in the fjrst half of 2017 of EUR 12.8 million includes EUR 11.4 million (2016: EUR 7.0 million) bank interest, EUR 2.3 million (2016: EUR 1.9 million) amortisation of fjnancing fees, net foreign exchange gains of EUR 1.2 million (2016 net foreign exchange losses of EUR 5.6 million), as well as other costs of EUR 0.4 million (2016: EUR 0.4 million). Income taxes Income tax expense decreased by EUR 0.7 million year-on-year to an Income tax charge of EUR 9.1 million for half year 2017. The decrease was primarily the result of profjt before tax spread over additional and growing low-tax jurisdictions (currently including Jersey and increased activity in both Guernsey and Cayman) as positive result of the Elian acquisition next to a decrease in the income tax rate in Luxembourg (from 29.22% to 27.08%). In the six months ended 30 June 2017 the income tax rate as a percentage of Profjt before taxes was 18.7% (2016: 30.0%) and was impacted mainly by an increase of tax deductible interest expenses (increased leverage due to Elian acquisition), a decrease in the non-deductible shared-based payments expenses and a decrease in non-deductible interests within the Fiscal Unity in Luxembourg. Cash fmow In the fjrst half of 2017, operating cash fmow increased by EUR 2.5 million (3.1%) compared to the same period of 2016. As a result of the Azcona acquisition, investing cash fmow expenses increased from EUR 3.9 million in half year 2016 to EUR 9.7 million in half year 2017. Cash fmow from fjnancing activities of EUR 80.2 million comprises mainly of purchase of treasury shares amounting to EUR 34.0 million, repayment of Revolving Credit Facility (RCF) loan of EUR 18.0 million and fjnal dividend of 2016 paid in June 2017 amounting to EUR 20.0 million. Related party transactions For related party transactions, please refer to note 15 of our interim fjnancial report. Principal risks and uncertainties of the fjrst half of 2017 In the Annual Report 2016, we described the key business risks and uncertainties which we are aware of, and which could have a material adverse efgect on our fjnancial position and results. We have assessed the risks for the fjrst half year of 2017 and believe that the risk categories and risk factors identifjed are in line with those presented in the Annual Report 2016. Those are deemed incorporated and repeated in this report by reference.

12 Intertrust N.V. Press Release – Q2 and H1 2017 results

slide-13
SLIDE 13

Other risks not known to us, or currently regarded not to be material, could later turn out to have a negative material impact on our business, objectives, revenues, income, assets, liquidity or capital resources. Responsibility statement With reference to the statement within the meaning of article 5:25d (2c) of the Financial Supervision Act, the Management Board hereby declares that, to the best of their knowledge:

  • the interim fjnancial statements prepared in accordance with IAS 34, “Interim Financial Reporting”, give a true and fair

view of the assets, liabilities, fjnancial position, profjt or loss of the company and the undertakings included in the consolidation taken as a whole; and

  • the interim Management Board report gives a fair review of the information required pursuant to section 5:25d(8)/(9) of

the Financial Supervision Act. Amsterdam, 23 August 2017 The Management Board David de Buck, Chief Executive Offjcer Maarten de Vries, Chief Financial Offjcer

13 Intertrust N.V. Press Release – Q2 and H1 2017 results

slide-14
SLIDE 14

Condensed consolidated interim statement of profjt or loss

(EUR 000) Note Q2 H1 2017 2016 2017 2016 Unaudited Unaudited Unaudited Unaudited Revenue 5 118,092 88,810 239,716 176,674 Stafg expenses 6 (54,564) (40,169) (109,014) (78,965) Rental expenses (5,960) (4,546) (12,029) (9,045) Other operating expenses (17,013) (13,550) (30,698) (21,815) Other operating income

  • 119
  • 119

Depreciation and amortisation of software (2,750) (2,051) (5,440) (4,020) Amortisation of acquisition-related intangible assets (10,493) (7,519) (20,621) (15,101) Profjt/(loss) from operating activities 27,312 21,094 61,914 47,847 Financial income 2 19 5 25 Financial expense (5,086) (9,831) (12,823) (14,940) Financial result (5,084) (9,812) (12,818) (14,915) Share of profjt of equity-accounted investees (net of tax) (192) (2) (195) (11) Profjt/(loss) before income tax 22,036 11,280 48,901 32,921 Income tax (3,069) (4,140) (9,138) (9,881) Profjt/(loss) after tax 18,967 7,140 39,763 23,040 Profjt/(loss) for the year after tax attributable to: Owners of the Company 18,970 7,120 39,714 23,039 Non-controlling interests (3) 20 49 1 Profjt/(loss) 18,967 7,140 39,763 23,040 Basic earnings per share (EUR) 7 0.21 0.08 0.44 0.27 Diluted earnings per share (EUR) 7 0.20 0.08 0.42 0.27

Quarterly fjgures are not audited, nor reviewed. The Notes on pages 18 to 25 are an integral part of these condensed consolidated interim fjnancial statements.

Condensed consolidated interim statement of comprehensive income

(EUR 000) Note Q2 H1 2017 2016 2017 2016 Unaudited Unaudited Unaudited Unaudited Profjt/(loss) after tax 18,967 7,140 39,763 23,040 Actuarial gains and losses on defjned benefjt plans 153 (1,311) 153 (1,311) Income tax on actuarial gains and losses on defjned benefjt plans

  • Items that will never be reclassifjed to profjt or loss

153 (1,311) 153 (1,311) Foreign currency translation difgerences - foreign operations (28,248) 3,157 (31,976) (9,653) Net movement on cash fmow hedges 525 (16,077) 1,211 (18,428) Income tax on net movement on cash fmow hedges (131) 4,019 (303) 4,607 Items that are or may be reclassifjed to profjt or loss (27,854) (8,901) (31,068) (23,474) Other comprehensive income/(loss) for the year, net of tax (27,701) (10,212) (30,915) (24,785) Total comprehensive income/(loss) for the year (8,734) (3,072) 8,848 (1,745) Total comprehensive income/(loss) for the year attributable to: Owners of the Company (8,731) (3,092) 8,799 (1,746) Non-controlling interests (3) 20 49 1 Total comprehensive income/(loss) for the year (8,734) (3,072) 8,848 (1,745)

Quarterly fjgures are not audited, nor reviewed. The Notes on pages 18 to 25 are an integral part of these condensed consolidated interim fjnancial statements.

14 Intertrust N.V. Press Release – Q2 and H1 2017 results

slide-15
SLIDE 15

Condensed consolidated interim statement of fjnancial position

(EUR 000) Note 30.06.2017 31.12.2016 Assets Property, plant and equipment 18,843 20,167 Software 13,088 15,120 Goodwill and acquisition-related intangible assets 8,9 1,515,015 1,565,367 Investments in equity-accounted investees 382 707 Other non current fjnancial assets 3,713 3,820 Deferred tax assets 582 2,480 Non-current assets 1,551,623 1,607,661 Trade receivables 75,387 99,160 Other receivables 14,818 15,021 Work in progress 35,796 31,984 Current tax assets 445 945 Other current fjnancial assets 1,104 1,627 Prepayments 9,762 8,167 Cash and cash equivalents 51,245 69,858 Current assets 188,557 226,762 Total assets 1,740,180 1,834,423 Equity Share capital 55,200 55,200 Share premium 630,441 630,441 Reserves (23,198) 42,345 Retained earnings 49,546 29,887 Equity attributable to owners of the Company 711,989 757,873 Non-controlling interests 175 1,930 Total equity 10 712,164 759,803 Liabilities Loans and borrowings 773,393 781,221 Other non current fjnancial liabilities 2,597 1,763 Employee benefjts liabilities 2,679 3,082 Deferred income 6,839 8,677 Provisions 358 1,147 Deferred tax liabilities 83,405 85,659 Non-current liabilities 869,271 881,549 Loans and borrowings 3,612 18,072 Trade payables 4,160 10,636 Other payables 51,675 66,974 Other current fjnancial liabilities 3,475

  • Deferred income

66,996 71,467 Provisions 530 2,219 Current tax liabilities 28,297 23,703 Current liabilities 158,745 193,071 Total liabilities 1,028,016 1,074,620 Total equity & liabilities 1,740,180 1,834,423

The Notes on pages 18 to 25 are an integral part of these condensed consolidated interim fjnancial statements.

15 Intertrust N.V. Press Release – Q2 and H1 2017 results

slide-16
SLIDE 16

Condensed consolidated interim statement of changes in equity

(EUR 000) For the period ended 30 June 2017 Attributable to owners of the Company Note Share capital Share premium Retained earnings Translation reserve Hedging reserve Treasury share reserve Other reserve Total Non- controlling interests Total equity Balance at 01 January 2017 55,200 630,441 29,887 7,627 (1,324) (76) 36,118 757,873 1,930 759,803 Profjt/(loss)

  • 39,714
  • 39,714

49 39,763 Other comprehensive income/(loss) for the year, net of tax

  • 153

(31,976) 908

  • (30,915)
  • (30,915)

Total comprehensive income/(loss) for the year

  • 39,867

(31,976) 908

  • 8,799

49 - 8,848 Contributions and distributions Equity-settled share-based payment

  • 3,577
  • 3,577
  • 3,577

Business combination

  • (56)

(56)

  • (56)

Purchase of treasury shares

  • (33,968)
  • (33,968)
  • (33,968)

Dividends paid

  • (22,535)
  • (451) (22,986)

(22,986) Total contributions and distributions

  • (18,958)
  • (33,968)

(507) (53,433)

  • (53,433)

Changes in ownership interests Dividends paid to non-controlling interests

  • (54)

(54) Acquisition non-controlling interest

  • (1,250)
  • (1,250)

(1,750) (3,000) Total changes in ownership interest

  • (1,250)
  • (1,250)

(1,804) (3,054) Total transactions with owners of the Company

  • (20,208)
  • (33,968)

(507) (54,683) (1,804) (56,487) Balance at 30 June 2017 10 55,200 630,441 49,546 (24,349) (416) (34,044) 35,611 711,989 175 712,164 (EUR 000) For the period ended 30 June 2016 Attributable to owners of the Company Note Share capital Share premium Retained earnings Translation reserve Hedging reserve Treasury share reserve Other reserve Total Non- controlling interests Total equity Balance at 01 January 2016 51,133 513,423 (2,457) 107 (16)

  • 562,190

124 562,314 Profjt/(loss)

  • 23,039
  • 23,039

1 23,040 Other comprehensive income/(loss) for the year, net of tax

  • (1,311)

(9,653) (13,821)

  • (24,785)
  • (24,785)

Total comprehensive income/(loss) for the year

  • 21,729

(9,653) (13,821)

  • (1,746)

1 (1,745) Contributions and distributions Issue of ordinary shares 4,067 117,018

  • 121,085
  • 121,085

Equity-settled share based payment

  • 2,696
  • 2,696
  • 2,696

Total contributions and distributions 4,067 117,018 2,696

  • 123,781
  • 123,781

Total transactions with owners of the Company 4,067 117,018 2,696

  • 123,781
  • 123,781

Balance at 30 June 2016 10 55,200 630,441 21,967 (9,546) (13,837)

  • 684,225

125 684,350

The Notes on pages 18 to 25 are an integral part of these condensed consolidated interim fjnancial statements.

16 Intertrust N.V. Press Release – Q2 and H1 2017 results

slide-17
SLIDE 17

Condensed consolidated interim statement of cash fmows

(EUR 000) Note Q2 H1 2017 2016 2017 2016 Unaudited Unaudited Unaudited Unaudited Cash fmows from operating activities Profjt/(loss) for the period 18,967 7,140 39,763 23,040 Adjustments for: Income tax expense 3,069 4,140 9,138 9,881 Share of loss/(profjt) of equity-accounted investees 192 1 195 10 Financial result 5,084 9,812 12,818 14,915 Depreciation and amortisation of software 2,750 2,051 5,440 4,020 Amortisation of acquisition-related intangible assets 10,493 7,519 20,621 15,101 (Gain)/loss on sale of non-current assets (2) 2 8 7 Other non cash items 2,256 1,691 3,385 2,836 42,809 32,355 91,368 69,810 Changes in: (Increase)/decrease in trade working capital (*) (13,219) (7,089) 7,981 17,620 (Increase)/decrease in other working capital (**) (6,124) 4,626 (7,763) (2,584) Increase/(decrease) in provisions (1,089) (466) (2,398) (555) Changes in foreign currency 984 (704) 1,402 (316) 23,361 28,722 90,590 83,975 Income tax paid (4,450) (1,000) (5,782) (1,691) Net cash from/(used in) operating activities 18,911 27,722 84,808 82,284 Cash fmows from investing activities Proceeds from sale of property, plant and equipment

  • 12

9 17 Purchase of property, plant & equipment (1,021) (968) (1,958) (1,921) Purchase of intangible assets (331) (355) (1,211) (1,772) Acquisitions, net of cash acquired (1,952)

  • (7,508)
  • (Increase)/decrease in other fjnancial assets

240 299 866 (206) Dividends received 53

  • 53
  • Interest received

2 19 5 25 Net cash from/(used in) investing activities (3,009) (993) (9,744) (3,857) Cash fmows from fjnancing activities Proceeds from issue of share capital

  • 120,780
  • 120,780

Proceeds from bank borrowings 3,532

  • 3,532
  • Acquisition of treasury shares

(32,278)

  • (33,968)
  • Payment of fjnancing costs

(25) (44) (50) (44) Repayment of loans and borrowings banks

  • (18,000)
  • Interest and other fjnance expenses paid

(5,808) (3,706) (11,696) (7,533) Dividends paid (19,962)

  • (19,962)
  • Dividends paid to non-controlling interest
  • (54)
  • Net cash from/(used in) fjnancing activities

(54,541) 117,030 (80,198) 113,203 Net increase/(decrease) in cash (38,639) 143,759 (5,134) 191,630 Cash attributable to the Company at the begining of the period 84,684 112,573 51,733 66,472 Efgect of exchange rate fmuctuations on cash attributable to the Company (1,439) (4,341) (1,993) (6,111) Cash attributable to the Company at the end of the period 44,606 251,991 44,606 251,991 Cash held on behalf of clients at the end of the period 6,639 9,413 6,639 9,413 Cash and cash equivalents at the end of the period 51,245 261,404 51,245 261,404 (*) Trade Working capital is defjned by the net (increase)/decrease in Trade receivables, Work in progress, Trade payables and Deferred income (**) Other Working capital is defjned by the net (increase)/decrease in Other receivables, Prepayments and Other payables (excl. liabilities for cash held on behalf of clients)

Quarterly fjgures are not audited, nor reviewed. The Notes on pages 18 to 25 are an integral part of these condensed consolidated interim fjnancial statements.

17 Intertrust N.V. Press Release – Q2 and H1 2017 results

slide-18
SLIDE 18

Notes to the condensed consolidated interim fjnancial statements

  • 1. Reporting entity

Intertrust N.V. (the “Company”) is a company domiciled in The Netherlands and was incorporated on 8 September 2014. The address of the Company’s registered offjce is Prins Bernhardplein 200, Amsterdam, The Netherlands. The condensed consolidated interim fjnancial statements are unaudited. The condensed consolidated interim fjnancial statements of the Company for the period from 1 January 2017 to 30 June 2017 comprise the Company and its subsidiaries (together referred as the “Group” and individually as “Group entities”) and the Group’s interest in associates. The Group provides corporate and funds services, private client services and capital markets services. At 30 June 2017, the Group has operations in 30 countries (30 June 2016: 23) and employs 2,452 FTEs (full-time equivalent employees) (30 June 2016: 1,705 FTEs).

  • 2. Basis of preparation

These condensed consolidated interim fjnancial statements for the six months ended 30 June 2017 have been prepared in accordance with IAS 34 Interim Financial Reporting. They do not include all the information required for a complete set of IFRS fjnancial statements. Accordingly, the condensed consolidated interim fjnancial statements should be read in conjunction with the annual fjnancial statements for the year ended 31 December 2016, which have been prepared in accordance with International Financial Reporting Standards (IFRS) as adopted by the European Union. Selected explanatory notes are included to explain events and transactions that are signifjcant to an understanding of the changes in the Group’s fjnancial position and performance since the last annual consolidated fjnancial statements as at and for the year ended 31 December 2016 (part of the “Annual Report 2016”). The presentation currency of the group is the euro (€). These condensed consolidated interim fjnancial statements were authorised for issue by the Management Board on 23 August 2017.

  • 3. Signifjcant accounting policies and standards

The accounting policies applied in these condensed consolidated interim fjnancial statements are the same as those applied in the Group’s consolidated fjnancial statements as at and for the year ended 31 December 2016. To the extent relevant, all IFRS standards and interpretations including amendments that were in issue and efgective from 1 January 2017, have been adopted by the group from 1 January 2017. These standards and interpretations had no material impact for the group. New standards and interpretations issued but not yet adopted All IFRS standards and interpretations that were in issue but not yet efgective for reporting periods beginning on 1 January 2016 have not yet been adopted and disclosed in the Group’s consolidated fjnancial statements as at and for the year ended 31 December 2016. No signifjcant changes to the disclosures are recognised at this stage.

18 Intertrust N.V. Press Release – Q2 and H1 2017 results

slide-19
SLIDE 19
  • 4. Use of estimates and judgements

The preparation of these interim fjnancial statements requires management to make certain assumptions, estimates and judgements that afgect the reported amounts of assets, liabilities and disclosure of contingent assets and liabilities as of the date of the interim fjnancial statements and the reported amounts of revenues and expenses during the reporting period. Actual results may difger from those estimates. The estimates and underlying assumptions are reviewed on an ongoing basis. Revisions to accounting estimates are recognised in the period in which the estimate is revised if the revision afgects only that period or in the period of revision and the future periods if the revision afgects both current and future periods. For areas involving a higher degree of judgement or areas where assumptions and estimates are signifjcant to the (interim) fjnancial statements, reference is made to Note 2.4 of the Group’s consolidated fjnancial statements as at and for the year ended 31 December 2016.

  • 5. Operating segments

5.1. Basis for segmentation The Management Board is the Chief Operating Decision Maker of the Group (CODM). The responsibility of the Management Board is to assess performance and to make resource allocation decisions across the Group. The analysis of the business is organised and managed on a geographical perspective. From 1 January 2017, due to integration of Elian, the Group no longer breaks out Elian results but defjnes the operating segments as Netherlands, Luxembourg, Cayman, Jersey and Rest of the World, whereby Guernsey is included in Rest of the World. All operating segments are regarded as reportable segments due to their size/importance for the overall understanding of the geographical business. They are reported in a manner consistent with the internal reporting provided to and used by the Management Board. The Management Board evaluates the performance of its segments based on Revenue and Adjusted EBITA (“segment Revenue” and “segment Adjusted EBITA”). Management considers that such information is the most relevant in evaluating the results of the respective segments. For the reconciliation, please see Reconciliation of performance measures to reported results. The individual Adjusted EBITA by operating segment excludes the allocation of Group IT and HQ costs, that is then deducted from the total. Profjt/(loss) before income tax is not used to measure the performance of the individual segment as items like amortisation

  • f intangibles (except for software) and net fjnance costs are not allocated to individual segments. So the reconciliation to

Profjt/(loss) before income tax according to IFRS is done on Group level. Consistent with the aforementioned reasoning, segment assets/liabilities are not reviewed regularly on a segment basis by management and are therefore not included in the IFRS segment reporting.

19 Intertrust N.V. Press Release – Q2 and H1 2017 results

slide-20
SLIDE 20

5.2. Information about reportable segments

Q2 H1 2017 2016 2017 2016 Unaudited Unaudited Unaudited Unaudited (EUR 000) Revenue % Revenue Revenue % Revenue Revenue % Revenue Revenue % Revenue Netherlands 27,579 23% 29,747 33% 56,644 24% 58,308 33% Luxembourg 23,521 20% 19,698 22% 47,616 20% 38,540 22% Cayman Islands 16,621 14% 12,358 14% 34,143 14% 25,704 15% Jersey 15,071 13%

  • 0%

29,687 12%

  • 0%

Rest of the World 35,300 30% 27,006 30% 71,626 30% 54,122 31% Segment Revenue 118,092 100% 88,809 100% 239,716 100% 176,674 100% Q2 H1 2017 2016 2017 2016 Unaudited Unaudited Unaudited Unaudited (EUR 000) Adjusted EBITA % Adjusted EBITA Adjusted EBITA % Adjusted EBITA Adjusted EBITA % Adjusted EBITA Adjusted EBITA % Adjusted EBITA Netherlands 16,797 40% 19,263 55% 35,238 40% 37,352 53% Luxembourg 11,920 29% 10,165 29% 25,395 29% 19,837 28% Cayman Islands 9,412 23% 6,752 19% 19,266 22% 14,767 21% Jersey 7,881 19%

  • 0%

14,926 17%

  • 0%

Rest of the World 11,442 27% 9,252 26% 24,923 28% 18,920 27% Group IT and HQ costs (*) (15,773)

  • 38%

(10,289)

  • 29%

(31,907)

  • 36%

(19,770)

  • 28%

Segment Adjusted EBITA 41,679 100% 35,143 100% 87,841 100% 71,106 100% (*) Group IT and HQ costs are not allocated by operating segment

For the six months ended 30 June 2016, the presentation of the fjgures has been aligned accordingly to the operating segments defjned post Elian acquisition. 5.3. Seasonality The business of the Group does not present pronounced cyclical patterns or seasonal evolutions in the condensed consolidated interim statement of comprehensive income.

  • 6. Stafg expenses

Q2 H1 (EUR 000) 2017 2016 2017 2016 Unaudited Unaudited Unaudited Unaudited Salaries and wages (40,804) (30,165) (83,603) (60,345) Social security contributions (4,011) (3,164) (7,994) (6,224) Pensions and benefjts (2,230) (1,868) (4,334) (3,726) Share-based payment upon IPO (629) (1,408) (1,109) (2,447) Share-based payment upon integration (428)

  • (832)
  • Share-based payment long term incentive plan

(1,144) (373) (1,697) (373) Other personnel expenses (5,318) (3,189) (9,445) (5,850) Stafg expenses (54,564) (40,168) (109,014) (78,965)

The number of FTEs (full time equivalent employees) at period ended 30 June 2017 amounted to 2,452 (period ended 30 June 2016: 1,705). Average number of employees amounted to 2,418 in the fjrst half of 2017 (2016 same period: 1,716). Share-based payment arrangements For the six months ended 30 June 2017, are included specifjc items for share based payment upon IPO of EUR 1,109 thousand (for the six months ended 30 June 2016: EUR 2,447 thousand) and upon integration of EUR 832 thousand (for the six months ended 30 June 2016: nil), related to the awards made under the equity-settled share-based payment

20 Intertrust N.V. Press Release – Q2 and H1 2017 results

slide-21
SLIDE 21

arrangements implemented following the listing of the Company’s shares on Euronext Amsterdam in 2015, following Elian acquisition in 2016 and Azcona acquisition in 2017. In April 2017, the group granted 433,852 million stock options under the share-based payment long term incentive plan ("LTIP") of which 38,352 stock options were granted to the management board. The purpose of the share-based compensation is to attract and retain management and employees and align the interests of management and eligible employees with those of shareholders, by providing additional incentives to improve the group's performance on a long- term basis. For further information on our share-based compensation, reference is made to note 8 in our Annual Report 2016.

  • 7. Earnings per share

(EUR 000) Q2 H1 2017 2016 2017 2016 Earnings per share Unaudited Unaudited Unaudited Unaudited Basic earnings per share (euro) 0.21 0.08 0.44 0.27 Diluted earnings per share (euro) 0.20 0.08 0.42 0.27

7.1. Basic earnings per share The calculation of basic earnings per share has been based on the following profjt attributable to ordinary shareholders of EUR 39,714 thousand for the six months ended 30 June 2017 (for the six months ended 30 June 2016: EUR 23,040 thousand) and weighted-average number of ordinary shares of 91,280,560 for the six months ended 30 June 2017 (for the six months ended 30 June 2016: 85,854,703). 7.2. Diluted earnings per share The calculation of diluted earnings per share has been based on the following profjt attributable to ordinary shareholders and weighted-average number of ordinary shares outstanding after adjustment for the efgects of all dilutive potential

  • rdinary shares of 3,115,119 for the six months ended 30 June 2017 (for the six months ended 30 June 2016: 295,214).

7.3. Adjusted net income per share The Group calculates the Adjusted net income for the six months ended 30 June 2017 to be EUR 64,5 million (for the six months ended 30 June 2016: EUR 51.9 million). Adjusted net income is defjned as Adjusted EBITA, less net interest costs of EUR 14.1 million (for the six months ended 30 June 2016: EUR 9.3 million) and less tax costs of EUR 9,1 million (for the six months ended 30 June 2016: EUR 9.9 million). Based on this Adjusted net income and taking the weighted-average number of basic shares for the six months ended 30 June 2017 of 91,280,560 (for the six months ended 30 June 2016: 85,854,703), the adjusted net income per share is EUR 0.71 (for the six months ended 30 June 2016: EUR 0.60).

  • 8. Acquisition-related intangible assets

During the six months ended 30 June 2017, additional acquisition-related intangible assets were generated in the acquisition of Azcona and SFM Spain (Note 9). The amortisation of acquisition-related intangible assets for the six months ended 30 June 2017 is EUR 20,621 thousand (for the six months ended 30 June 2016: EUR 15,101 thousand).

21 Intertrust N.V. Press Release – Q2 and H1 2017 results

slide-22
SLIDE 22

The goodwill per CGU is tested annually for impairment. As at 30 June 2017, there were no impairment indicators and no impairment testing was performed for the period. The intangible assets other than goodwill were not tested for impairment because there were no impairment indicators at 30 June 2017.

  • 9. Business combinations

2017 Acquisition of remaining SFM Spain stake and affjliated local service provider On 1 February 2017, the Group has acquired the remaining 25% stake in Intertrust Management Spain, S.L. (“SFM Spain”) together with the affjliated professional services activities of Azcona y Asociados de Consultoría Tributaria, Jurídica y Contable, S.L. (“Azcona”). The Group acquired a 75% stake in SFM Spain as part of the acquisition of Elian on 23 September 2016. The remaining 25% of SFM Spain was held by Azcona, a local Spanish competitor that specialises in the provision of corporate secretarial, accounting and tax compliance services. The transaction strengthens the Group’s position in Spain, making it a leading independent provider of capital markets, funds and corporate services. All Azcona stafg members have transferred to the Intertrust team, thereby more than doubling the headcount of the Madrid offjce to a total of 63 employees. The increased scale of the combined offjce strengthens the Group’s client service capabilities and broadens its career opportunities for employees. Signifjcant asset recognised other than the acquisition of the remainder of the shares was attributable mainly to revenues from new customers and the workforce. The transaction does not have a material impact on the Company’s fjnancial position or results. 2016 Acquisition of Elian Group On 23 September 2016, the acquisition of Elian Group (“Elian”) from Elian’s management and funds managed by Electra Partners LLP has been completed. Elian is a Jersey-based regional trust & corporate services provider, specialist in Capital Markets and Private Equity & Real Estate fund administration, with a leadership position in Jersey and a strong presence in the UK and 13 other jurisdictions. Elian further reinforces Intertrust’s position as the global leader in the trust and corporate services sector by strengthening its Capital Markets and Private Equity & Real Estate Fund Administration Services, expanding its geographical presence to jurisdictions such as Jersey, and adding scale in other key locations like Ireland, the United Kingdom, and Cayman Islands. The combination also enhances the career opportunities available to the combined company’s employees. Intertrust’s listed company underscores its transparency, adds to its attractiveness as an employer and makes it the “go-to” company for fjnancial institutions, fund, corporations and high net worth individuals. From acquisition to 31 December 2016, Elian contributed revenue of EUR 28,496 thousand and Adjusted EBITA of EUR 9,726

  • thousand. Based on management estimates, Elian’s revenue for 2016 was GBP 92.2 million and adjusted EBITA was GBP

30.4 million. For more detailed disclosures we refer to note 6 in our Annual Report 2016.

  • 10. Capital and reserves

10.1. Share capital The subscribed capital as at 30 June 2017 amounts to EUR 55,200 thousand and is divided into 91,999,392 thousand shares fully paid-up with a nominal value per share of EUR 0.60. On 13 June 2016, Intertrust N.V. issued 6,777,778 ordinary shares for the purchase of Elian Group.

22 Intertrust N.V. Press Release – Q2 and H1 2017 results

slide-23
SLIDE 23

10.2. Share premium At 30 June 2017, the share premium amounts to EUR 630,441 thousand. In June 2016, the addition to the share premium from the proceeds of the issue of ordinary shares was EUR 122,000 thousand less the costs directly attributable to the equity transaction for EUR 1,220 thousand net of the related tax impact

  • f EUR 305 thousand.

10.3. Retained earnings The retained earnings include accumulated profjts and losses, plus remeasurements of defjned benefjt liability (asset) and equity-settled share-based payment. The fjnal dividend for the year 2016 of EUR 0.25 per share was paid on 12 June 2017. An interim distribution of EUR 0.28 per share over fjnancial year 2017 will be payable on the group's ordinary shares. The payment will be subject to 15% Dutch withholding tax. The interim dividend has not been recognised as liability. Treasury share reserve The treasury share reserve comprises the costs of the Company’s shares held by the Group. At 30 June 2017, the Group held 1,856,354 of the Company’s shares (31 December 2016: 3,705). The shares acquired during the six months ended 30 June 2017 are in relation to the share buy-back program for the Elian deferred consideration shares.

  • 11. Financial instruments

Credit risk Our internal credit risk assessment did not change compared to the disclosure Note 28 in our Annual Report 2016. With respect to the net trade receivables, there are no indications as of the reporting date that the debtors will not meet their payment obligations. Liquidity risk There has been no change in our liquidity risk assessment compared to our disclosure Note 28 in our Annual Report 2016. Currency risk The Group’s exposure to the risk of changes in exchange rates relates primarily to the Group’s operating activities (when revenue or expense is denominated in a difgerent currency from the Group’s presentation currency). This did not change compared to previous year. The exposures are mainly with respect to the US dollars (USD) and Pound sterling (GBP). The loans and borrowings of the Group are denominated in Euros, Pound sterling and US Dollars. Interest rate risk The risk relates to the Group’s long term debt obligations with fmoating interest rates. To manage this risk the company continues to hold interest rate swaps. Capital management The capital structure or the Group did not change signifjcantly. Leverage ratio at the end of the reporting period is 3.81 as cash was used to buy back shares and pay out the fjnal net dividend for FY2016. This is still within the agreed level of our current facilities.

23 Intertrust N.V. Press Release – Q2 and H1 2017 results

slide-24
SLIDE 24

Fair value and fair value estimation The fair values of our fjnancial assets and liabilities as at 30 June 2017 are estimated to approximate their carrying value. There has been no change in the fair value estimation technique and hierarchy of the input used to measure the fjnancial assets/liabilities carried at fair value through profjt or loss compared with the method and hierarchy disclosed in our Annual Report 2016.

  • 12. Cash fmow hedges

The balance at 30 June 2017 includes interest rate swap to cover part of the fmuctuations on the fmoating interest on the USD and EUR debt. During the six months ended 30 June 2017, the Group entered into two additional interest rate swaps to cover part of the fmuctuations on the fmoating interest on the EUR and GBP debt.

  • 13. Contingencies

There was a remaining potential tax liability towards the Swiss tax authorities disclosed in our Annual Report 2016. This related to a late payment interest charge imposed by the Swiss tax authorities in the amount of CHF 9.1 million in connection with the late payment of Swiss dividend withholding tax on a cash dividend paid in 2010 to its former

  • shareholders. The Group has timely fjled a formal tax appeal against the imposition with the Swiss tax authorities, outlining

various arguments as to why we believe the contingency is not due. On 1 February 2017 favourable related legislation has been enacted. As per 4 April 2017 the Swiss Tax Authorities have as expected issued a formal favorable decision on the tax complaint fjled per 12 September 2014, whereby the entire amount of late payment interests has been rescinded in line with newly enacted legislation, hence this particular contingency no longer exists. The Belgian tax authorities have delivered a notice to the third party liquidator of one of our former subsidiaries for tax and penalties in the amount of approximately EUR 16.4 million (excluding interest) in connection with Belgian dividend withholding tax over the payment of liquidation proceeds of this subsidiary in 2012. The exemption for dividend withholding tax has been challenged by the tax authorities on technical grounds. A formal tax complaint in view of full rescindment had been fjled in due course as there are good grounds to challenge the tax assessment. Following formal decision received in February 2017, a partial rescindment for an amount of approx. EUR 6.5 million has been obtained. As per 21 May 2017 a formal court petition has been fjled within legal deadline as we continue to believe there to be good grounds to counter the position taken by the tax authorities. The further treatment and outcome of the petition is bound to be pending for quite some time as pleading date has been set by the Court for 7 March 2019 at the earliest. We furthermore believe that it is still more likely than not that a full release can be obtained. An amount of approx. EUR 9.8 million (excluding interest) remains under further dispute. There is a legal claim which negatively impacted our half year 2017 fjgures including those related legal fees. The amount we recognised as a loss in our profjt and loss account is included in the non-recurring items' list. We believe that there is a reasonable chance that we can recover all or part of this amount in due course. There are a few additional possible claims against the Group. One of them is against one of our subsidiaries that provided directorship services to a client entity, which is involved in legal proceedings relating to taxation. We concluded that in aggregate amount, including the above mentioned claims against the Group, these litigations cannot be reliably measured or we consider that the possibility of outfmow is not probable. Where necessary legal and/or external advice has been obtained and, in light of such advice, the risk of litigation is provided adequately.

24 Intertrust N.V. Press Release – Q2 and H1 2017 results

slide-25
SLIDE 25
  • 14. Commitments

In the fjrst half of 2017, there were no material changes to the group’s commitments from those disclosed in note 30 of

  • ur Annual Report 2016 except for IT related commitments whereas the group engaged with Microsoft for new services.

The contract increases the commitments of the group by EUR 4,044 thousand spread for the coming 3 years period.

  • 15. Related parties

During the six months ended 30 June 2017, the transactions with related parties were conducted on an arm’s length basis. The transactions with key management personnel do not deviate signifjcantly from the transactions as refmected in the fjnancial statements as at and for the year ended 31 December 2016. The Groups has provided services to some entities related to Blackstone in the normal course of business on an arm’s length basis.

  • 16. Subsequent events

There are no signifjcant events that have occurred since balance sheet date that would change the fjnancial position and which would require adjustment or disclosure in these condensed consolidated interim fjnancial statements.

  • 17. Non-IFRS Financial measures

Defjnitions For the defjnitions of non-fjnancial measures we refer to the Glossary in the Annual Report 2016. Other than those defjned there, we give more clarifjcation as listed below on:

  • Adjusted EBITDA is defjned as EBITDA excluding specifjc items.
  • Adjusted net income is defjned as adjusted EBITA less net interest costs, less tax costs and share of profjt of equity-

accounted investees (net of tax).

  • Specifjc items of income or expenses are income and expenses items that, based on their signifjcance in size or nature,

should be separately presented to provide further understanding about the fjnancial performance. Specifjc items include:

  • Transaction and monitoring costs
  • Integration and transformation costs
  • Restructuring cost
  • Share-based payment upon IPO
  • Share-based payment upon integration
  • Income/expenses related to disposal of assets

Specifjc items are not of an operational nature and do not represent the core operating results.

25 Intertrust N.V. Press Release – Q2 and H1 2017 results

slide-26
SLIDE 26

Review report

To: the shareholders, the Managing Board and the Supervisory Board of Intertrust N.V. Introduction We have reviewed the accompanying condensed consolidated interim fjnancial information as at 30 June 2017 of Intertrust N.V., Amsterdam, which comprises the statement of fjnancial position as at 30 June 2017, the statements of profjt or loss, comprehensive income, changes in equity, and cash fmows for the period of six months ended 30 June 2017 and the notes. The Management Board of the Company is responsible for the preparation and presentation of this condensed consolidated interim fjnancial information in accordance with IAS 34 ‘Interim Financial Reporting’ as adopted by the European Union. Our responsibility is to express a conclusion on this interim fjnancial information based on our review. Scope We conducted our review in accordance with Dutch law including standard 2410, ‘Review of Interim Financial Information Performed by the Independent Auditor of the Entity’. A review of interim fjnancial information consists of making inquiries, primarily of persons responsible for fjnancial and accounting matters, and applying analytical and other review procedures. A review is substantially less in scope than an audit conducted in accordance with auditing standards and consequently does not enable us to obtain assurance that we would become aware of all signifjcant matters that might be identifjed in an

  • audit. Accordingly, we do not express an audit opinion.

Conclusion Based on our review, nothing has come to our attention that causes us to believe that the accompanying condensed consolidated interim fjnancial information as at 30 June 2017 and for the six months then ended is not prepared, in all material respects, in accordance with IAS 34 ‘Interim Financial Reporting’ as adopted by the European Union. Three months interim fjnancial information not audited or reviewed The Company did not prepare condensed consolidated interim fjnancial information for the three months period ended 30 June 2016 and for the three months period ended 30 June 2017 and therefore such quarterly information are not audited or reviewed. Consequently, the three months fjgures included in the statements of profjt or loss, comprehensive income, changes in equity and cash fmows and in the related notes of the condensed consolidated interim fjnancial information as at 30 June 2017 have not been audited or reviewed. Amstelveen, 23 August 2017 KPMG Accountants N.V. W.G. Bakker RA

26 Intertrust N.V. Press Release – Q2 and H1 2017 results