
SLIDE 1
HSBC Holdings plc 1Q 2015 Results Presentation to Investors and - - PowerPoint PPT Presentation
HSBC Holdings plc 1Q 2015 Results Presentation to Investors and Analysts Important notice and forward-looking statements Important notice The information set out in this presentation and subsequent discussion does not constitute a public offer
2
Important notice The information set out in this presentation and subsequent discussion does not constitute a public offer for the purposes of any applicable law or an offer to sell or solicitation of any offer to purchase any securities or other financial instruments or any recommendation in respect of such securities or instruments. Forward-looking statements This presentation and subsequent discussion may contain projections, estimates, forecasts, targets, opinions, prospects, results, returns and forward-looking statements with respect to the financial condition, results of operations, capital position and business of the Group (together, “forward-looking statements”). Any such forward-looking statements are not a reliable indicator of future performance, as they may involve significant assumptions and subjective judgements which may or may not prove to be correct and there can be no assurance that any of the matters set out in forward-looking statements are attainable, will actually occur or will be realised or are complete or accurate. Forward-looking statements are statements about the future and are inherently uncertain and generally based on stated or implied assumptions. The assumptions may prove to be incorrect and involve known and unknown risks, uncertainties, contingencies and other important factors, many of which are outside the control of the Group. Actual achievements, results, performance or other future events or conditions may differ materially from those stated, implied and/or reflected in any forward-looking statements due to a variety of risks, uncertainties and other factors (including without limitation those which are referable to general market conditions or regulatory changes). Any such forward-looking statements are based on the beliefs, expectations and opinions of the Group at the date the statements are made, and the Group does not assume, and hereby disclaims, any obligation or duty to update them if circumstances or management’s beliefs, expectations or opinions should change. For these reasons, recipients should not place reliance on, and are cautioned about relying on, any forward-looking statements. Additional detailed information concerning important factors that could cause actual results to differ materially is available in our 1Q15 Earnings Release. This presentation contains non-GAAP financial information. The primary non-GAAP financial measure we use is ‘adjusted performance’ which is computed by adjusting reported results for the period-on-period effects of foreign currency translation differences and significant items which distort period-on-period comparisons. Significant items are those items which management and investors would ordinarily identify and consider separately when assessing performance in order to better understand the underlying trends in the business. Reconciliation of the difference between the non-GAAP financial measurements with the most directly comparable measures under GAAP is provided in the 1Q15 Earnings Release available at www.hsbc.com.
3
Notes: 1. Net operating income before loan impairment charges and other credit risk provisions, excluding currency translation and significant items 2. Excludes currency translation and significant items
6,543 2,904 6,892 (1,173) 1Q14 4Q14 1Q15
with 1Q14.
and an increase in adjusted2 PBT of USD349m or 5%
global businesses
USD483m reflecting higher staff costs and increased marketing spend
Reported and Adjusted2 PBT (USDm)
Currency translation and significant items Adjusted2 PBT Reported
Highlights
6,785 7,059
Financial performance Capital
(end point basis) of 11.2% Strategy
167 242 1,731
Adjusted2 PBT increased by USD349m
4
Notes: 1. All figures are reported unless otherwise stated 2. Excludes currency translation and significant items 3. On an annualised basis 4. Return on average tangible equity measures the return attributable to ordinary shareholders, excluding the impairment of goodwill and the movement in the present value of in-force long-term insurance business (‘PVIF’) net of tax,
5. Calculated as percentage growth in adjusted net operating income before loan impairment charges and other credit risk provisions less percentage growth in adjusted operating expenses, 1Q15 versus 1Q14 6. From 1 January 2015 the CRD IV transitional CET1 and end-point CET1 capital ratios became aligned for HSBC Holdings plc due to recognition of unrealised gains on investment property and available-for-sale securities
Key ratios, % 1Q14 4Q14 1Q15 Target (if applicable) Return on average ordinary shareholders’ equity3 11.7% 0.8% 11.5% >10% Return on average tangible equity3,4 13.7% 1.0% 13.1% n/a Jaws (adjusted)5 n/a n/a (1.5)% Positive Advances-to-deposits ratio 73.9% 72.2% 72.5% n/a Common equity tier 1 ratio (end point basis)6 10.8% 11.1% 11.2% n/a Common equity tier 1 ratio (transitional basis)6 10.7% 10.9% 11.2% n/a Summary financial highlights, USDbn Better/(worse) 1Q14 4Q14 1Q15 1Q15 vs 4Q14 1Q15 vs 1Q14 Reported PBT 6.8 1.7 7.1 5.4 0.3 Adjusted2 PBT 6.5 2.9 6.9 4.0 0.4
5
Middle East and North Africa 349 35 (483) 136 661 19%
Reported and Adjusted1 PBT (USDm)
Notes: 1. Excludes currency translation and significant items 2. Net operating income before loan impairment charges and other credit risk provisions
Adjusted1 PBT Analysis 1Q15 vs 1Q14 (USDm)
4% (6)% 5% 6,543 6,178 6,482 2,904 6,892 (623) (1,873) (1,173) 1Q14 2Q14 3Q14 4Q14 1Q15 Revenue2 LICs Operating expenses PBT Associates and JVs 6% Currency translation and significant items Adjusted1 PBT Reported
Adjusted1 PBT increased by USD349m
Adjusted1 PBT by region 1Q15 vs 1Q14 (USDm)
(27) (62) (35) 232 241 Europe Asia Latin America North America
42 30
Adjusted1 PBT by global business 1Q15 vs 1Q14 (USDm)
RBWM CMB GB&M GPB Other 2% 2% 10% (2)%
16% 6% (7)% (12)% (10)% 280
6,785 5,555 4,609 1,731 7,059
Adverse Favourable Adverse Favourable Adverse Favourable 167 242
6
1,139 461 755 689 486 1Q14 2Q14 3Q14 4Q14 1Q15 661 39 (4) (71) 436 190 186 16% 3% (28)% 5% (49)% 9% (1)% 4%
Reported and Adjusted revenue1 (USDm)
Notes: 1. Net operating income before loan impairment charges and other credit risk provisions excluding the effect of currency translation and significant items 2. Includes intersegment revenue variance of USD(138)m 3. Mainly includes the distribution and manufacturing (where applicable) of retail and credit protection insurance 4. Includes Markets products, Insurance and Investments and Other 5. Mainly includes Securities Services, Payments and Cash Management and Global Trade and Receivables Finance
1Q15 vs 1Q14 Adjusted revenue1 by global business (USDm)
Currency translation and significant items Adjusted revenue1 Reported Total Other2 GPB Legacy credit GB&M excl Legacy credit CMB RBWM US run-off portfolio Principal RBWM (115)
1Q15 vs 1Q14 Adjusted revenue1 by global business (USDm)
(250) 250
Principal RBWM USD186m USD190m CMB GB&M excl legacy credit Personal lending Current accounts, savings and deposits Wealth products Credit and Lending Global Trade and Receivables Finance Payments and Cash Management Markets Balance Sheet Management Capital Financing, Principal Investments and other5 USD436m Other3 Other4 14,745 14,822 15,020 13,617 15,406
Adjusted revenue1 increased by USD661m
Adverse Favourable Adverse Favourable
15,884 15,283 15,775 14,306 15,892
7
841 862 870 887 903 83 89 95 52 53 1Q14 2Q14 3Q14 4Q14 1Q15
Notes: 1. Comparatives have been retranslated at 31 March 2015 rates. The reported quarterly balances for Loans and advances to customers are as follows: 1Q14 USD1,010bn; 2Q14 USD1,047bn; 3Q14 USD1,029bn; 4Q14
2. ‘Red-inked’ balances refer to a number of corporate overdraft and corresponding deposit positions where clients benefit from net interest arrangements, but where net settlement is not intended to occur
1Q15 vs 4Q14 Loans and advances to customers1 excl. red-inked balances2 (USDbn) 1Q15 vs 4Q14 Customer accounts1
Loans and advances to customers1 (USDbn) Customer account balances1 (USDbn)
1,178 1,208 1,222 1,254 1,266 83 89 95 52 53 1Q14 2Q14 3Q14 4Q14 1Q15 1,261 1,297 1,319 1,306 1,317 2% 16
7 (1) 5 1% (4)% 3% 2%
Principal RBWM RBWM US run-off portfolio CMB GB&M GPB Total
12 (1) 4
2% 1% (2)% 1% RBWM CMB GB&M GPB Total 924 951 956 939 965
USD16bn increase
Constant currency basis1 Customer accounts excl. 'red-inked' balances2 'Red-inked' balances2 Loans and advances to customers excl. 'red-inked' balances2 'Red-inked' balances2 Constant currency basis1
Adverse Favourable Adverse Favourable
8
(200) 8,043 8,471 8,590 10,124 8,526 943 2,501 1,768 319 1Q14 2Q14 3Q14 4Q14 1Q15
Notes: 1. Excludes currency translation and significant items 2. 2Q14 and 1Q15 include positive adjustments relating to the UK Bank Levy charge from the previous year, both totalling USD45m 3. Includes intersegment cost variance of USD138m.
1Q15 vs 1Q14 Adjusted1 operating expenses By global business (USDm) Reported and adjusted1 operating expenses (USDm)
8,852 8,845 Principal RBWM RBWM US run-off portfolio CMB GB&M GPB Other3 Currency translation and significant items Adjusted1 operating expenses Reported (7)% 33% (6)% (10)% 2% (16)%
By Drivers (USDm)
Regulatory Programmes and Compliance Marketing Other costs 9,414 11,091 11,892 (220) 76 (98) (213) 8 (36) 809
Adjusted1 operating expenses increased by USD483m
Levy 1,108m2
Investment in growth Wage inflation Adverse
Staff costs Non-staff costs
Adverse Favourable
9
0.31% 0.38% 0.26% 0.48% 0.24% (500) 500 1,000 1,500 2,000 2,500 1Q14 2Q14 3Q14 4Q14 1Q15 Geographical regions % 1Q14 1Q15 Europe4 0.10 0.01 Asia 0.12 0.11 Middle East and North Africa (0.30) 0.12 North America 0.55 0.24 Latin America 3.89 3.74 Total 0.31 0.24 Global Businesses % 1Q14 1Q15 RBWM 0.63 0.50 CMB 0.25 0.31 GB&M 0.00 (0.17) GPB (0.05) 0.02 Other (0.12) 0.05 Total 0.31 0.24
Loan impairment charges (USDm) Loan impairment charges / average gross loans and advances to customers1,2 (%)
706 902 632 1,154 570 LICs3 Collectively assessed Individually assessed Other credit risk provisions LICs / Avg Gross L&A1,2
Notes: 1. Loan impairment charges and other credit risk provisions (LICs) 2. LICs are annualised and presented on an adjusted basis translated at 1Q15 rates. Average gross loans are presented on a constant currency basis 3. Quarterly LICs are presented on an adjusted basis translated at 1Q15 rates. Reported quarterly LICs are as follows: 1Q14 USD798m; 2Q14 USD1,043m; 3Q14 USD760m; 4Q14 USD1,250m; 4. Decrease was mainly in GB&M driven by lower individually assessed impairment allowances in Capital Financing
10
Group RoE1
2.3 2.4 1Q14 1Q15 2.4 2.3 1Q14 1Q15
Adjusted3
2.5 2.4 1Q14 1Q15
Adjusted ex run-off4 Reported Group RoRWA2, %
Notes: 1. ROE has been calculated on an annualised reported basis 2. RoRWAs are calculated using average RWAs based on a CRD IV basis for 1Q15, 4Q14 and 1Q14 and on a Basel 2.5 basis for 4Q13 3. Adjusted RoRWAs are calculated using adjusted PBT and reported RWAs at constant currency, adjusted for disposals. 4. Includes GB&M Legacy credit, US CML and other run-off portfolio
1Q15 11.5 Other (0.1) Dividend to preference shares (AT1) (0.3) Adjusted
expenses (0.9) Adjusted LICs 0.2 Adjusted revenue 1.2 Currency translation and significant items (0.3) 1Q14 11.7
11
Notes: 1. From 1 January 2015 the CRD IV transitional CET1 and end-point CET1 capital ratios became aligned for HSBC Holdings plc due to recognition of unrealised gains on investment property and available-for-sale securities 2. The partial sale of our shareholding in Industrial Bank had no material impact on the Group’s capital ratios 3. This includes dividends on ordinary shares, quarterly dividends on preference shares and coupons on capital securities, classified as equity
Common equity tier 1 ratio movement (%)
CRD IV End point1
At 31 December 2014 136.0 Capital generation 4.1 Profit for the period (including regulatory adjustments) 4.6
First interim dividend3, net of planned scrip (1.7) Higher 2014 fourth interim dividend scrip take-up 1.2 Foreign exchange translation differences (4.1) Further impact on the partial sale of shareholding in Industrial Bank2 (1.4) Other movements 1.0 At 31 March 2015 135.6
Movement in risk-weighted assets (CRD IV end point) (USDbn)
Total
At 31 December 2014 1,219.8 Asset growth 17.1 Traded risk 16.0 Foreign exchange translation differences (26.6) Management initiatives: (9.7) Legacy reduction and run-off (6.0) RWA initiatives (3.7) Partial sale of shareholding in Industrial Bank2 (9.4) Methodology change and model update 4.6 Other movements 0.8 At 31 March 2015 1,212.6
Movement in common equity tier 1 capital (USDbn)
0.1
Profit for the period (including regulatory adjustments)
0.4
31 Dec 2014 End point
11.1
Unrealised gains arising from revaluation
and AFS fair value reserve (add back)
0.2
31 Dec 2014 Transitional
10.9 (0.1)
Traded risk and other movements
11.2
31 Mar 2015 End point Foreign exchange translation differences
(0.1)
Asset growth
(0.2)
Management initiatives
1
13
USDm 1Q14 4Q14 1Q15 Currency translation 336 (22)
Revenue (Loss) / gain on sale of several tranches of real estate secured accounts in the US (30) 92
18
8
4
17 Gain on the partial sale of shareholding in Industrial Bank
Favourable / (adverse) debit valuation adjustment on derivative contracts 30 (54) 98 Adverse fair value movements on non-qualifying hedges (142) (200) (285) (Provisions) / releases arising from the ongoing review of compliance with the Consumer Credit Act in the UK
12 Own credit spread 148 432 298 53 191 486 Loan impairment charges and other credit risk provisions2 (1)
Trading results – HSBC Bank (Colombia) S.A. (9)
(4)
(10)
(40) (128) (43) Settlements and provisions in connection with foreign exchange investigations
(83) (340) (137) Regulatory provisions in GPB
(139) (146) (1,342) (319) Currency translation and significant items 242 (1,173) 167
Notes: 1. HSBC Bank Middle East Limited disposed of its banking business in Jordan during June 2014. There were no gains or losses relating to this disposal. 2. Relates to the trading results of HSBC Bank Middle East Limited’s Pakistan operations and HSBC Bank (Colombia) S.A.
14
USDm 1Q14 4Q14 1Q15 Net interest income 8,721 8,547 8,274 Net fee income 4,046 3,718 3,684 Net trading income 2,280 1,190 2,583 Net income from financial instruments designated at fair value 508 557 1,596 Gains less losses from financial investments 184 420 647 Dividend income 24 22 17 Net earned insurance premiums 3,136 2,605 2,979 Other operating income 328 270 338 Total operating income 19,227 17,329 20,118 Net insurance claims and benefits paid and movements in liabilities to policyholders (3,343) (3,023) (4,226) Net operating income before loan impairment charges and other credit risk provisions 15,884 14,306 15,892 Loan impairment charges and other credit risk provisions (798) (1,250) (570) Net operating income 15,086 13,056 15,322 Total operating expenses (8,852) (11,892) (8,845) Operating profit 6,234 1,164 6,477 Share of profit in associates and joint ventures 551 567 582 Profit before tax 6,785 1,731 7,059 Cost efficiency ratio % 55.7 83.1 55.7
Note: 1. Reported basis
15
USDm 31 Dec 2014 31 Mar 2015 Assets Cash and balances at central banks 129,957 133,025 Trading assets 304,193 334,261 Financial assets designated at fair value 29,037 28,181 Derivatives 345,008 378,815 Loans and advances to banks 112,149 116,267 Loans and advances to customers 974,660 956,225 Reverse repurchase agreements – non trading 161,713 172,262 Financial investments 415,467 390,234 Other assets 161,955 160,454 Total Assets 2,634,139 2,669,724 Liabilities Deposits by banks 77,426 78,410 Customer accounts 1,350,642 1,318,522 Repurchase agreements – non trading 107,432 117,474 Trading liabilities 190,572 208,636 Financial liabilities designated at fair value 76,153 72,471 Derivatives 340,669 376,577 Debt securities in issue 95,947 105,380 Liabilities under insurance contracts 73,861 72,427 Other liabilities 121,459 123,333 Total liabilities 2,434,161 2,473,230 Equity Total shareholders’ equity 190,447 187,137 Non-controlling interests 9,531 9,357 Total equity 199,978 196,494 Total equity and liabilities 2,634,139 2,669,724
Note: 1. Reported basis
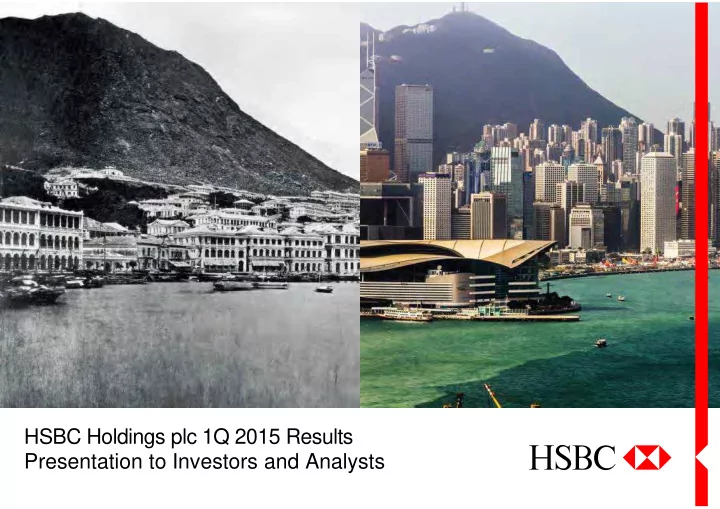
Issued by HSBC Holdings plc Group Investor Relations 8 Canada Square London E14 5HQ United Kingdom Telephone: 44 020 7991 3643 www.hsbc.com Cover images: HSBC – then and now It is 150 years since HSBC was founded in Hong Kong to finance trade between Asia and Europe. Much has changed since then, as our cover photos demonstrate. The left photo shows Hong Kong harbour, with the HSBC office (extreme left) a few years after it was established in 1865. The right image shows the harbour today, with the HSBC building fifth from left (partially hidden). Hong Kong has been transformed both physically and economically, from trading outpost to international financial centre. HSBC has mirrored Hong Kong’s rise to global prominence, growing from a small regional trading bank into one of the world’s largest banking and financial services organisations today. HSBC’s Hong Kong office is still at 1 Queen’s Road Central, as it was in 1865. The current HSBC building is the fourth to occupy the site, but the values on which the bank was founded remain the same. HSBC still aims to be where the growth is, connecting customers to opportunities, enabling businesses to thrive and economies to prosper, and helping people to fulfil their hopes and realise their ambitions. We are proud to have served our customers with distinction for 150 years. Photographs: (left) HSBC Archives; (right) Matthew Mawson Cover designed by Creative Conduct Ltd, London. 02/15