
SLIDE 1
1
This press release includes unaudited financial information
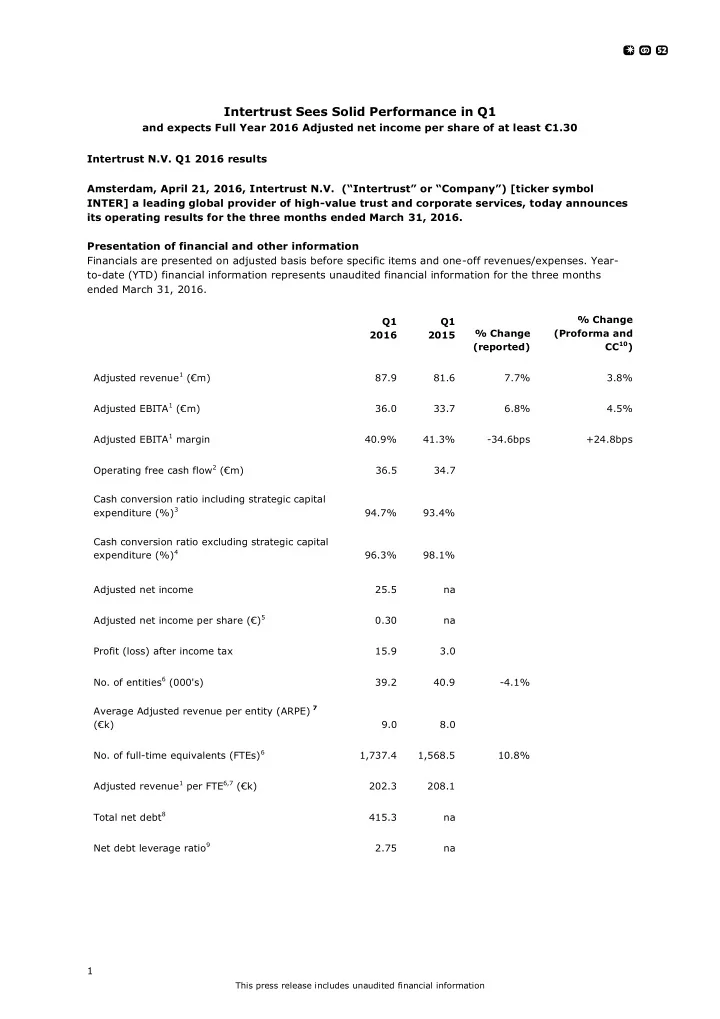
Intertrust Sees Solid Performance in Q1
and expects Full Year 2016 Adjusted net income per share of at least €1.30 Intertrust N.V. Q1 2016 results Amsterdam, April 21, 2016, Intertrust N.V. (“Intertrust” or “Company”) [ticker symbol INTER] a leading global provider of high-value trust and corporate services, today announces its operating results for the three months ended March 31, 2016. Presentation of financial and other information Financials are presented on adjusted basis before specific items and one-off revenues/expenses. Year- to-date (YTD) financial information represents unaudited financial information for the three months ended March 31, 2016. Q1 Q1 % Change (reported) % Change (Proforma and CC10) 2016 2015 Adjusted revenue1 (€m) 87.9 81.6 7.7% 3.8% Adjusted EBITA1 (€m) 36.0 33.7 6.8% 4.5% Adjusted EBITA1 margin 40.9% 41.3%
- 34.6bps
+24.8bps Operating free cash flow2 (€m) 36.5 34.7 Cash conversion ratio including strategic capital expenditure (%)3 94.7% 93.4% Cash conversion ratio excluding strategic capital expenditure (%)4 96.3% 98.1% Adjusted net income 25.5 na Adjusted net income per share (€)5 0.30 na Profit (loss) after income tax 15.9 3.0
- No. of entities6 (000's)
39.2 40.9
- 4.1%
Average Adjusted revenue per entity (ARPE) 7 (€k) 9.0 8.0
- No. of full-time equivalents (FTEs)6