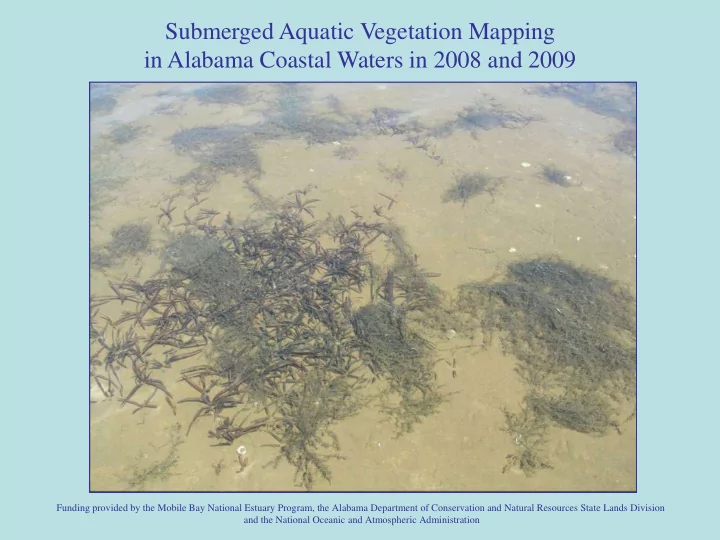

Submerged Aquatic Vegetation Mapping in Alabama Coastal Waters in 2008 and 2009 Funding provided by the Mobile Bay National Estuary Program, the Alabama Department of Conservation and Natural Resources State Lands Division and the National Oceanic and Atmospheric Administration
NOAA Coastal Change Analysis Program (C-CAP) --- Digital feature mapping using aerial photography and complementary surface-level verification • Remote sensing using ortho imagery produced from aerial photographs • SAV signatures digitized in GIS to create ESRI polygon coverage • Field surveys for database development and accuracy assessments
Aerial Imagery Acquisition → Environmental conditions must be suitable for detecting submerged features • Minimal cloud cover, wind and waves • Low turbidity • Sun angles between 30 and 45º • Low tides • Peak SAV biomass
Field surveys • Data was collected at 182 field locations in 2008 and 1,326 locations in 2009 • Visual assessment of dominant species and bed density Accuracy testing of the completed delineation • Spatial – Bed boundary locations in the field compared with GIS polygon boundaries → Average horizontal error was 3.17 meters • Thematic – Verification of cover type → Accuracy determined to be 90% Timing is critical!
• Project was originally intended for 2007 but was postponed due to poor water clarity. • Suboptimal conditions persisted through the Summer 2008. • Aerial imagery was acquired October 2008 for the southern portion of the study area. ➔
SW Mobile County 2008
SE Baldwin County 2008
Full Area Survey Aerial imagery acquired July 2009
Comparison of 2008 and 2009 Acreage USGS QUADRANGLE OCT 2008 ACREAGE JULY 2009 ACREAGE DIFFERENCE Fort Morgan 6.8 0.0 - 6.8 Fort Morgan NW 31.4 25.2 - 6.2 364.2 - 183.9 Grand Bay 548.1 Grand Bay SW 86.8 61.8 - 25.0 1.5 + 0.1 Gulf Shores 1.4 129.2 - 226.5 Isle aux Herbes 355.7 Kreole 230.1 218.8 - 11.3 150.8 + 3.8 Orange Beach 147.0 Perdido Bay 135.1 135.4 + 0.3 Petit Bois Pass 142.1 142.3 - 0.2 1.2 -- Pine Beach 1.2 TOTAL 1,685.7 1,230.4 - 455.3 Mobile County; Baldwin County
Less widgeon grass ( Ruppia maritima ) in Mississippi Sound in 2009 compared to 2008.
2009 acreage by species (habitat) category. HABITAT ACREAGE Eurasian watermilfoil, southern naiad, wild celery 1005.9 Wild celery 978.6 Eurasian watermilfoil 804.3 Shoal grass 467.3 Shoal grass, widgeon grass 436.6 Eurasian watermilfoil, southern naiad 365.9 Widgeon grass 313.1 Eurasian watermilfoil, southern naiad, widgeon grass, wild celery 201.7 Eurasian watermilfoil, water stargrass 187.6 Eurasian watermilfoil, wild celery 155.8 Sago pondweed 78.7 Coon’s tail, Eurasian watermilfoil, southern naiad, wild celery 76.9 Sago pondweed, wild celery 63.6 Coon’s tail, Eurasian watermilfoil, water stargrass, wild celery 35.1 Eurasian watermilfoil, water stargrass, wild celery 13.7 Southern naiad 12.8 Brittle waternymph, southern naiad 10.5 Coon’s tail, small pondweed, southern naiad 3.3 Water stargrass 3.1 Eurasian watermilfoil, leafy bladderwort 1.7 Twoleaf watermilfoil 1.1 Turtle grass 0.04 Northern portion of study area; Southern portion of study area
The lower Mobile- Tensaw Delta contained 77% of the total 2009 SAV acreage.
Comparison of 2009 Acreage with the 2002 Baseline Survey USGS 2009 ACREAGE DIFFERENCE 2002 ACREAGE QUADRANGLE 3,450.3 - 190.7 3,641.0 Bridgehead 21.2 - 5.7 26.9 Chickasaw 35.1 + 25.6 9.5 Daphne 25.2 + 25.2 Fort Morgan NW 0.0 364.2 + 67.8 Grand Bay 296.4 61.8 - 18.1 Grand Bay SW 79.9 1.5 + 0.3 Gulf Shores 1.2 Hollinger’s Island 0.0 -126.7 126.7 1.9 - 515.4 517.3 Hurricane 129.2 + 41.6 Isle aux Herbes 87.6 218.8 - 77.1 Kreole 295.9 509.8 - 497.2 Mobile 1,007.0 150.8 + 90.8 Orange Beach 60.0 135.4 + 20.8 Perdido Bay 114.6 142.3 + 82.7 Petit Bois Pass 59.6 Pine Beach 0.1 1.2 + 1.1 265.2 0.0 - 265.2 The Basin 5,248.7 -1,340.2 TOTAL 6,588.9 Northern portion of the study area; Southern portion of the study area
Recommend
More recommend