
SLIDE 1
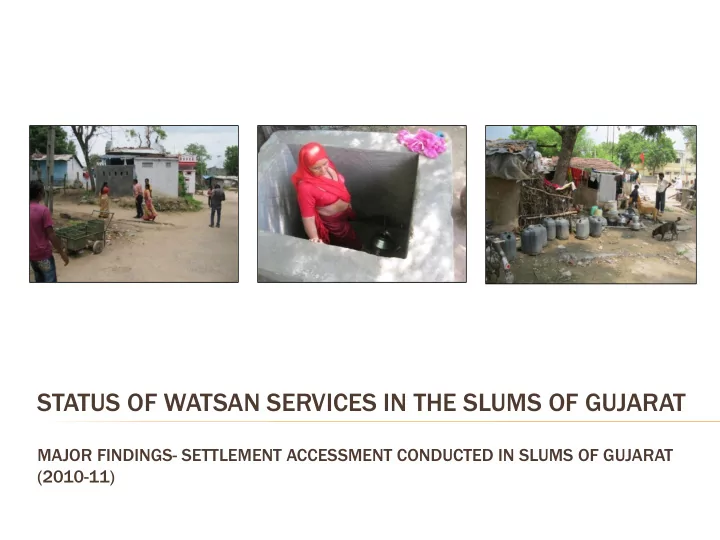
STATUS OF WATSAN SERVICES IN THE SLUMS OF GUJARAT
MAJOR FINDINGS- SETTLEMENT ACCESSMENT CONDUCTED IN SLUMS OF GUJARAT (2010-11)
STATUS OF WATSAN SERVICES IN THE SLUMS OF GUJARAT MAJOR FINDINGS- - - PowerPoint PPT Presentation
STATUS OF WATSAN SERVICES IN THE SLUMS OF GUJARAT MAJOR FINDINGS- SETTLEMENT ACCESSMENT CONDUCTED IN SLUMS OF GUJARAT (2010-11) STRUCTURE OF PRESENTATION Context Defining slums Settlement level assessment- Methodology Services at
MAJOR FINDINGS- SETTLEMENT ACCESSMENT CONDUCTED IN SLUMS OF GUJARAT (2010-11)
Context Defining slums Settlement level assessment- Methodology Services at a glance Major findings:
NSSO Defin initi tion
“A slum is a compact settlement of at least 20 households with a collection of poorly built tenaments, mostly of temporary nature, crowded together usually with inadequate sanitary and drinking water facilities in unhygienic conditions” Census sus 2011 Definiti inition
congested tenements, in unhygienic environment usually with inadequate infrastructure and lacking in proper sanitary and drinking water facilities.” MoHUP UPA Commi mmitt ttee e for Census sus 2011 “A compact settlement of at least 20
households with a collection of poorly built tenements, mostly of temporary nature, crowded together usually with inadequate sanitary and drinking water facilities in unhygienic conditions” In addition, it also lists the following as slum-like characteristics:
within premises of the census house
drainage.
The Gujarat arat Slum Areas (Impr proveme ement nt, Clearan arance ce and Redevelopment elopment) ) Ac Act, t,1973 73- Secti tion n 3 Chapt pter er 2- Declarati aration
m areas
(a)
That any area is a source of danger to the health, …….., insanitary, squalid, overcrowded, or
(b)
That the buildings in any area, used or intended to be used for human habitation are (i) in any respect , unfit for human habitation, or (ii) by reason of dilapidation, overcrowding, faulty arrangement and design of such buildings, narrowness or faulty arrangement of streets, lack of ventilation, light or sanitation facilities or any combination of these factors, detrimental to safety, health or morals, In determining whether a building is unfit for human habitation, for the purposes of this Act, regard shall be had to its condition in respect of the following: Repair (ii) stability (iii) freedom from damp (iv) natural light and air (v) water-supply (vi) drainage and sanitary conveniences (vii) facilities for storage, preparation and cooking
Also referred to in the ‘Regulation for Rehabilitation and Redevelopment of Slums, 2010’ For the purpose se of this assess essment nt, the areas listed ed as slums ms by the ULBs s have been n consid sidered ered
Conducted in 2010-11 by Urban Management Centre Ob
Meth
Preliminary meetings with CEO & Community Organizer Visit to all the slum settlements in the city, collection of data using checklist Collation and analysis of the data on the basis
indicators
HHs have individual connections HHs do not have individual connections
HHs have individual toilets HHs do not have individual toilets HHs have access to door-to- door waste collection HHs do not have access to door-to-door waste collection
Cities % Slum Population Class A 21 Class B 20 Class C 26 Class D 26 Average 23.25
5.2 13.8 21.9 40.0 37.8 25.0 15.8 8.4 13.1 22.9 24.1 22.0 29.5 3.5 29.3 20.5 25.2 18.8 0.0 10.0 20.0 30.0 40.0 50.0 60.0 70.0 80.0
Botad, Anand and Morbi -low percentage slum population at 3.5%, 5.2% and 8.4% respectively. Godhra with 40% and Jetpur with 37.8% have high percentage of slum population
Indicator UMC Slum Survey PAS Household survey, NIELSEN % slums having water supply network 91% NR % HHs in slums having access to individual water supply connections 61% 60% % HHs in slums practising open defecation 44% 23% % slums having underground sewerage network 38% NR % HHs in slums having access to individual toilets 45% 59% % slums having sold waste collection network 77% NR % HHs in slums having access to door-to- door solid waste collection 49% 37%
coverage
days/month),
infrastructure is not a challenge in slums, but providing last-mile household connectivity is. Water supply, Vallabhipur
778 778 290 290 112 112 111 111 88 88 76 76 70 70 67 67 44 44 35 35 24 24 14 14 200 200 400 400 600 600 800 800 1000 1000
Veraval Lunavada Bhayavadar Chhaya Dahod Sutrapada Borsad Devgadh Pethapur Kansad Gandevi Paradi
Households per standpost
Small (7-65 HHs) sized slums/temporary in nature Standard ratio – 15 HH/ stand post
Community stand post in Mansa
Inter ervent ntion ions The 500 NOC Scheme, Ahmedabad aims at providing slum residents with a ‘No Objection Certificate’ (NOC) that enables them to apply for legal individual sewerage and water connections for their dwellings. ‘ General resolution by Bardoli Nagar Palika
network in slum settlements- Bacchau, Gadhada and V.V. Nagar (All C Class towns)
sewerage network in its slums Open drain in Mansa
their premises (NIELSON- 60%)
+ non-slum)- 88% (Census, 2011)
use toilets
among other Class A cities (37%), high OD rate of 63%, Sanitation ranking 407th out
32.00 41.00 50.00 57.00 0.00 10.00 20.00 30.00 40.00 50.00 60.00
Class A Class B Class C Class D
% HH practi tici cing ng open defecat ecation ion
ULB OD OD toile let covg. HH/toi
let seat at ratio tio Sanand (C ) 99 22 Borsad (B) 90 10 Karamsad (C ) 86 14 Rapar (D) 80 20 Halol (C ) 98 9 Chaya (C ) 85 7 Prantij (D) 86 14 Savali (D) 87 13 Pethapur (D) 97 5 1 Bantwa (D) 90 10 1.2 Umreth (C ) 87 13 1.8 Ranavav (C ) 89 46 2.5 Radhapur (C) 87 13 7.5
Cities exhibiting high OD rate, low toilet access and complete absence of pay and use or community toilets Open defecation in Bhabar
Locked community toilets observed in Harij, Jafrabad, Mansa, Talaja
Lack of maintenance observed in most
Functi ctiona nality ty- Functionality of pay-and-use toilets is much more than that of community toilets Functionality of > 70%- 22% ULBs (community toilets) and 45% ULBs (pay- and use toilets)
63.66 49.24 41.93 39.32 0.00 10.00 20.00 30.00 40.00 50.00 60.00 70.00 Class A Class B Class C Class D Average- 49%
Findin ings gs Average Coverage- 49%, 37% (NIELSON) Frequency of collection- very low i.e. once in two weeks, (NIELSO- 14% slums are covered by daily SW collection 23% ULBs have no SW collection Jafrabad garbage dumping site
Service ice Provide der ULBs- 96% cities Private- Kheda (29%), Chanasma (17%), Talod (67%), Kansad (50%) Residents- Rapar (14%), Vijapur (63%) Bavla- Private (78%)+ Residents (22%) Waste collection in Borsad
Class HH Water Supply Connections HH Access to Toilets HH Covered by Solid Waste Services A Kalol, Patan, Surendranagar (85%) Porbandar (90%), Kalol (81%), Anand, Valsad (82%) Valsad, Gandhidham (100%), Patan (96%), Vapi (95%) Veraval (22%), Vapi (32%) Surendranagar (37%) Morbi, Surendranagar, Veraval (0%), Porbandar (24%) B Vadhvan (94%), Gondal (87%), Bhuj (85%) Okha (88%), Dolka, Kadi (85%) Dholka (99%), Bhuj (97%), Siddhpur (95%) Dahod (14%), Borsad (17%), Borsad (10%), Palitana (22%), Gondal (38%) Dhangadha, Borsad, Palitana, Vadhvan, Viramgam (0%), Mahua (2%), Amreli (6%) C Karjan (96%), Bavla (93%), Kodinar (92%) Bhachau (84%), Kodinar (94%), V.V. Nagar (100%) Kodinar (70%), Padra (89%), Mansa (88%) Chaya (0%), Lunavada (13%), Paradi (22%) Chaya (7%), Halol (8%), Umreth (13%), Karamsad (14%) Chaya (0%), Halol (11%), Jambusar (22%), Talaja (17%) D Chanasma (97%), Boriavi (96%), Tharasdi (94%) Mandvi K (100%), Vijapur (85%) Oad (98%), Harij (89%), Dharampur (83.3), Talod (84%) and Mahudha (91.2%) Sutrapada (0%), Kansad (7%), Pethapur (9%) Pethapur (5%), Bantwa (10%), Savali (13%) Pethapur (0%), Kanjari (10%), Sojitra (20%),
Surendr dranagar anagar, , Borsad sad, , Pa Palita tana, , Chaya ya, , Halol, , Pet etha hapur pur need d to draw urgent nt atten enti tion
ces in its slum m set ettlement tlements