
SLIDE 1
Technology
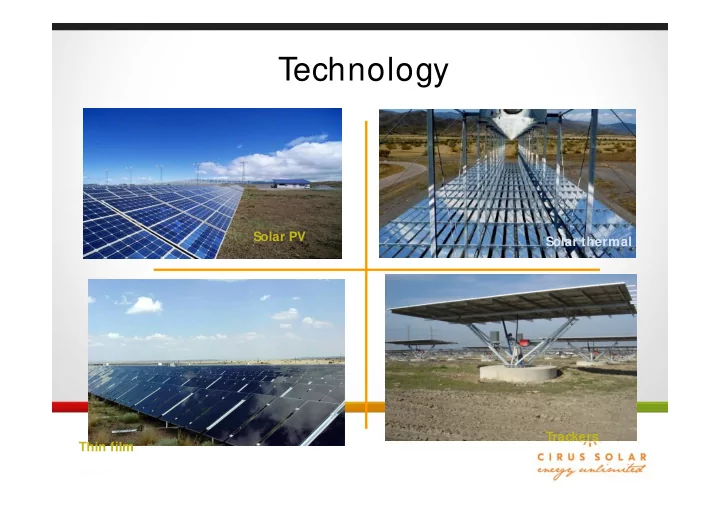
- Solar PV
Solar thermal Thin film Trackers
Technology Solar PV Solar thermal Trackers Thin film SOLAR - - PowerPoint PPT Presentation
Technology Solar PV Solar thermal Trackers Thin film SOLAR PROJ ECT REFERENCES Team with Execution Experience Client Volume (M W) State Client 1 25 Gujarat Client 2 8 Gujarat Gujarat Client 3 5 Client 4 1 Gujarat Client 5
Solar thermal Thin film Trackers
Client Volume (M W) State
Client 1 25 Gujarat Client 2 8 Gujarat Client 3 5 Gujarat Client 4 1 Gujarat Client 6 5 Rajasthan Client 5 25 Gujarat Client 7 1 Rajasthan
TOTAL 75
Client 8 5 Andhra Pradesh
Bhoomi Puja 27th April 2011 Site Handover 16th M ay Rainy days July to 10th Sept November 10th 2011 28th December 2011
Speedy and Quality Execution Quick deployment of resources
EXECUTION
25 M W Solar Power Plant
Scope Technology Location Turnkey EPC , O&M Solar PV Crystalline Charanka, Gujarat COD 29-Dec -2011
5 M W Solar Power Plant
Scope Technology Location Turnkey EPC , O&M Solar PV Crystalline Bacho, Kutch, Gujarat Commissioned on 5th M ay 2012
8 M W Solar Power Plant
Scope Technology Location Turnkey EPC , O&M Solar PV Crystalline M ithapur, Gujarat COD 25-Jan -2012
5 M W Solar Power Plant
Scope Technology Location Turnkey EPC , O&M Solar PV Thinfilm COD 7-Feb -2012 Bikanair, Rajastan
Photovoltaic Crystalline M ono M ulti Thin Film Amorphous CIGS CdTe Concentrated (CPV) Thermal Parabolic trough Linear Fresnel Parabolic dish Solar Tower
Crystalline Thin Film CPV
Parabolic Trough Solar Tower Parabolic Dish
12
Fixed System Single Axis Dual Axis
5000 10000 15000 20000 25000 04:00 06:00 08:00 10:00 12:00 14:00 16:00 18:00
Energy output [kWh/ M Wp]
20.0% 30.0%
13
5000 10000 15000 20000 25000 04:00 06:00 08:00 10:00 12:00 14:00 16:00 18:00
Energy Output (kWh) Time of day
jan feb mar apr may jun jul aug sep
nov dec
14
Fixed System Single Axis Dual Axis
50000 100000 150000 200000 250000
Energy output [kWh/ M Wp]
20.0% 30.0%
15
5MWp Building Blocks Substation with Protections
GRID
16
Local Controls Remote Monitoring Interface Modules String Monitor/Combiner Protections Inverter Substation GRID Module Mounting Structure
17
Sno Station Advantage 1 NAS A Gives 22 year average , Software is free of cost 2 M eteo Norm Gives 10 Y ear Average data , data is measured with a scaling of 200 kms , software is available at cost , compatible with all software's for simulation 3 S wera Limited no of M eteo stations , mostly used for Europe .Data is available in the net for free of cost 4 3 Tier Gives 10 Y ear Average data . Software is available at cost , compatible with all software's for simulation
1.2m 0.6m 1.66m 0.99m Weight : 18kg Watts: 85Wp Vmpp: 87.5V Impp: 0.9A efficiency: 8% Tech: a-Si
Tech: µc-Si
Weight : 20kg Watts: 225Wp Vmpp: 29.6V Impp: 7.6A efficiency: 13%
26
27
34
M ounting System / Structure Fixed System Fixed with yearly average optimal angle Fixed with seasonal tracking (M anual) Single Axis tracking System Tracking at 0 Deg Tracking at yearly average optimal angle Tracking with seasonal tilt Dual Axis tracking System Tracking one angle automatic and seasonal tilt (manual)
Tracking at
round the year
37
System Area In Acres Crystalline Silicon Thin Film Fixed 3.5 – 5.0 7.5 – 10.0 Single Axis Tracker 6.0 – 7.0 10.5 - 13.5 Dual Axis Tracker 8.0 – 12.0 11.5 – 15.0
39
System Increase In Energy Output Crystalline Silicon Fixed Seasonal Tilt 5 % Single Axis Tracker 15- 20 % Dual Axis Tracker 25- 30 %
41
technician
inverters of 10kW
an engineer to install
4 # 250kW or 2 # 500kW
43
46
Surge Protective Devices Site Lightning Protection AC MCCB Surge Protective Devices Fused Disconnect Switch Fused MCB To Substation Solar PV Array
S
Inverter (built in Protections)
Earthing
47
Inverter to HT
HT Panel
Electronic Energy Meters
Electronic Energy Meters
LA CT PT Bkr
Transformer 33KV GRID
Bkr Iso
LA Iso LA
Sno Voltage Rating M egawatt Type of Conductor Losses per Km 1 11 KV 1 M W Weasel 0.76 % 2 11 KV 1 M W Rabbit 0.45 % 3 33 KV 5 M W Dog 0.13% 4 33 KV 5 M W Panther 0.06% 5 33 KV 10 M W Panther 0.13 % 5 132 KV 10 M W Zebra 0.02% 6 132 KV 25 M W Zebra 0.05 %
50
emperature, irradiation, string level current values, etc. is recorded and the data is transmitted for monitoring.
early stage.
and detect any deviation from ideal performance.
and yield losses.
51
52
Regular Maintenance Module cleaning Weather station Performance monitoring Preventive Maintenance Inverters, Junction Boxes, Fuses Substation transformers, CT, PT, Fuses, breakers Removing any shrubs/Grass that can shade the modules Site Safety Site Security Warranty and Insurance Spares and tools System Health Remote Monitoring
54
PV M odules : IEC 61215 - Standard for Crystalline M odules IEC 61646 - Standard for Thin Film M odules IEC 61730 - Standard for Safety Testing of M odules IEC 61701 - Standard for Salt M ist Test IEC 62246 - Standard for Onsite commissioning and inspection for grid connected systems IEC 61724 - Standard for Plant Performance monitoring Cables : IS 1554 - Standard code for PVC cables IS 7098 - Standard code for XLPE cables Structure : IS 2062 - Standard for Steel for General Structural Purpose IS 875 - Standard for wind loading Substation : Transformer : IS 2026 HT panels : IS 13118 and IEC 62271 Lighting Protections : NFC 17-102 – Early Streamer emission air terminals protection Earthing : IS 3043 - Code of practice for Earthing
Raj Balakrishna
President & Co-Founder
Cirus Solar M : +91 8008700136 Raj.b@cirussolar.com Cirus Solar M : +91 8008100135 Vishnu.r@cirussolar.com
www.cirussolar.com
Vishnu Vardhan Reddy
CEO & Co=Founder
Corporate Back up EPC expertise Financial Support Technical backup by Silicon Valley Veterans Optimum Design Low Cost BOM Project Monitoring Vishnu Reddy, CEO & Founder
Silicon Valley veteran with experience in management of S ystems and Solar projects globally with 30 years of global experience. B.E (ECE) and M .T ech (ICS) and M .S in Electrical Engineering from Tuskegee Institute, Alabama, USA
Rajendra Balakrishnan, President & Founder
Silicon Valley veteran with more than 30 years diversified management experience in global Solar and Semiconductor industry. B.E (ECE), M . T ech (ECE) and M .S in Electrical Engineering from Howard University, Washington, D.C., USA
Pre- Engineering
1. Site Selection 2. Technology Options 3. DPR 4. Financial Feasibility Reports
Engineering Procurement
1. Extensive Component Understanding 2. Economy of scale – pricing advantage 3. Product Warranties 4. Long term Support
Construction
1. Project M gmt. 2. Security 3. Scheduling 4. Civil 5. Electrical 6. Sub Station 7. Timely Execution 8. Acceptance Testing 9. Commissioning
O&M
1. Security 2. M aintenance (Cleaning) 3. Periodic inspection 4. Trouble shooting 5. Remote M onitoring 1. Optimum Eng. 2. Approvals PPA, Land, Grid 3. Local Permits 4. Vendor Selection 5. Procurement
1 1 5 25 5 5 8 25
Thin Film Crystalline
TECHNOLOGY
Ability to evaluate different types of technologies Thin Film Crystalline Solar Thermal Tracking System Team executed with Thin film Technology (32 M W) and Crystalline Technology (43 M W) Projects ranging from 1M W to 25M W
CONTENT
High Quality & Low cost content (US suppliers – First Solar, Solar World, Power One)
EXECUTION
Team with experience of commissioning 75 M W. Satisfied clients
TECHNOLOGY
Experienced team to design high efficiency solutions
FINANCE
Easy access & Low cost financing
62 PV Supply Chain
Poly Silicon Wafer Cells Modules
Power Plants & EPC
Solar M odule Construction