
SLIDE 1
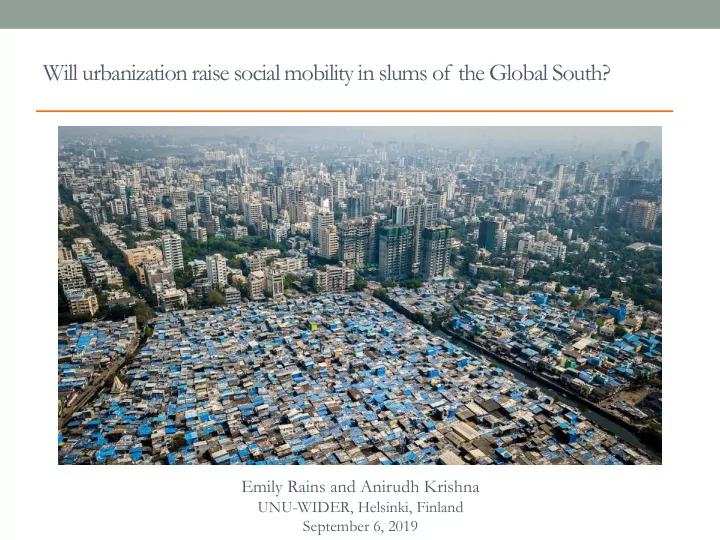
Will urbanization raise social mobility in slums of the Global South?
Emily Rains and Anirudh Krishna
UNU-WIDER, Helsinki, Finland September 6, 2019
Will urbanization raise social mobility in slums of the Global South? - - PowerPoint PPT Presentation
Will urbanization raise social mobility in slums of the Global South? Emily Rains and Anirudh Krishna UNU-WIDER, Helsinki, Finland September 6, 2019 Overview Todays s slums will n not e experience br broadba based socia ial m mobil
Emily Rains and Anirudh Krishna
UNU-WIDER, Helsinki, Finland September 6, 2019
Act
agrarian country on the outskirts of Europe” (Salonen 2001)
covered less than one-tenth of the population, but by 1930 their coverage was two-thirds” (Kangas & Palme, 2005)
policy supports (Kasza, 2006; Milly, 1999).
principally through the provision of housing, health, and educational benefits”(Findlay & Wellisz, 1993)
Percent urban is the percentage of population classified as urban. The dependency ratio is the size of the population under 15 years old and over 65 years old divided by the size of the population aged 15-65. Data are extracted from historical U.S. census reports.
0% 10% 20% 30% 40% 50% 60% 70% 80% 90% 100% 1840 1850 1860 1870 1880 1890 1900 1910 1920 1930 1940 Percent urban Dependency ratio
Percent urban is the average percentage of population classified as urban according to national definitions. The dependency ratio is the size of the population under 15 years old and over 65 years old divided by the size of the population aged 15-65. Data are from World Urbanization Prospects.
0% 10% 20% 30% 40% 50% 60% 70% 80% 90% 100% 1950 1955 1960 1965 1970 1975 1980 1985 1990 1995 2000 2005 2010 2015 2020 2025 2030 2035 2040 2045 2050 Africa (% urban) Asia (% urban) Latin America (% urban) Africa (dep. ratio) Asia (dep. ratio) Latin America (dep. ratio)
Stages-of-progress Occupational mobility Patna Jaipur Bengaluru % moved up 60% 65% 95% % moved down 16% 16% 02% % stayed poor 92% 70% 83% % stayed nonpoor 02% 07% 00% Patna Jaipur Bengaluru % moved up 31% 36% 43% % moved down 17% 18% 9% % stayed in same type
52% 46% 47%
Data are from International Labour Organization.
0.5 1 1.5 2 2.5
1 2 3 4
Standard deviation of change in stages-of-progress Slum score