
SLIDE 1
Urbanization and sustainable development David Satterthwaite, IIED - - PowerPoint PPT Presentation
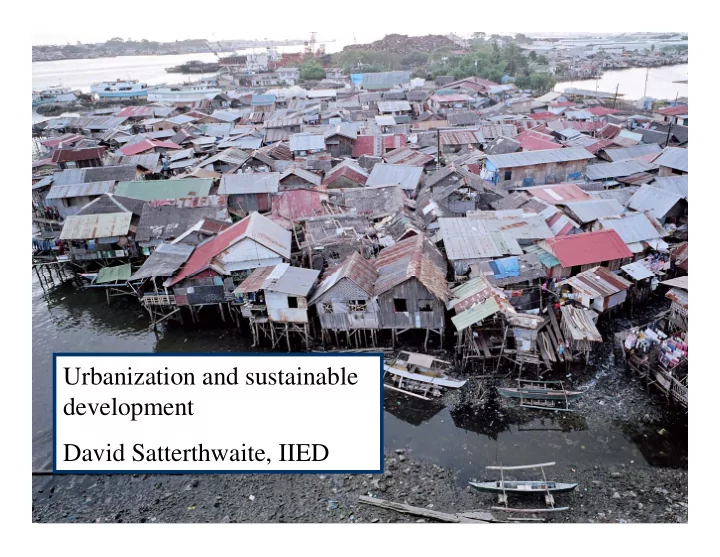
Urbanization and sustainable development David Satterthwaite, IIED How can urbanization be a problem if All rich nations are highly urbanized; all the poorest nations predominantly rural All the most successful economies in Africa,
Cities with lower unit costs
– Economies of scale/proximity for providing piped water, sewers, drains, health care, education, emergency services……
Cheaper to keep down energy use, cut wastes,
WHY DO MOST GOVERNMENTS SEE
– The mayor who said “The best urban policy – keep people in rural areas”
Meeting people’s needs
– Economic, environmental, social, cultural, health and political needs.........
Without compromising ability of future
– limit generation of environmental costs – sustainable use of finite resources (soils, freshwater...) – limit greenhouse gas emissions
In 2008, more than half the world’s population
Two less well-known milestones
– 1980, more than half the world’s economically active population working in industry & services – not agriculture (today 65%) – 1940, more than half the world’s GDP was generated in industry and services, not agriculture (today 97%)
Urbanization follows economic success
– People moving in response to where new investment and jobs concentrate
10 20 30 40 50 60 70 80 90 100 1950 1955 1960 1965 1970 1975 1980 1985 1990 1995 2000 2005 Percentage
% GDP from industry and services % labour force in industry and services Level of urbanization
1 20 30 40 50 60 70 80 90 1 00 1 950 1 955 1 960 1 965 1 970 1 975 1 980 1 985 1 990 1 995 2000 2005
1 20 30 40 50 60 70 80 90 1 00 1 950 1 955 1 960 1 965 1 970 1 975 1 980 1 985 1 990 1 995 2000 2005
Sub-Saharan Africa India
Low- and middle-income nations
10 20 30 40 50 60 70 80 90 100 1950 1955 1960 1965 1970 1975 1980 1985 1990 1995 2000 2005 Percentage 10 20 30 40 50 60 70 80 90 100 1950 1955 1960 1965 1970 1975 1980 1985 1990 1995 2000 2005 Percentage
10 20 30 40 50 60 70 80 90 100 1950 1955 1960 1965 1970 1975 1980 1985 1990 1995 2000 2005 Percentage
10 20 30 40 50 60 70 80 90 100 1950 1955 1960 1965 1970 1975 1980 1985 1990 1995 2000 2005 Percentage
Distribution of the world's 'million-cities', 2000
The world’s other 207 nations and territories The fourth five largest economies (Australia, Turkey, South Africa, Argentina, Netherlands) The third five largest economies (Mexico, Canada, Rep Korea, Spain, Indonesia) The second five largest economies (France, UK, Italy, Brazil and Russia) The worlds five largest economies (USA, China, Japan, India, Germany)
Economic logic to where urbanization is taking place
– Private investment goes to cities that provide economies of scale and agglomeration – A few exceptions (political change, war/civil strife, disasters)
Well-functioning cities essential for economic
– Economies of scale/agglomeration for businesses, economics of scale and proximity for almost all forms of infrastructure and services
In successful economies, urbanization decentralizes
– Especially if there are competent, capable local governments
Concentrate people, industries, vehicles and their
– Cholera, typhoid, diarrhoeal diseases, ARI...... – Much of the population in slums/squatter settlements – One child in five dying – Urban life poor, nasty, brutish and short (Thomas Hobbes)
Use potential advantages of this concentration for
The more urbanized a nation, the higher the life
– All the most urbanized nations with high life expectancies – But good city government needed to deliver this
84.1 79 78 76.2 74.2 60.9 53.7 50 50 44.6 41 25 10 20 30 40 50 60 70 80 90 T
y
a n g k
P
t
l e g r e S a
a u l
u n i s D h a k a B u j u m b u r a N . D j a m e n a K i n s h a s a L i l
g w e C
a k r y P
, m a n y A f r i c a n c i t i e s ?
Good city governance can deliver 10-30
Good health statistics for a city depends on
driven by city governments?)
dwellers who offer governments partnerships: in India, South Africa, Namibia, Kenya, Malawi, the Philippines..
Institute in Pakistan on sanitation, drainage.....
income groups in Thailand, supported by CODI
with the low-income population, not against them
Cities unfairly blamed for global warming
and of industries & high-income people outside cities Well planned/governed cities can cut link
greenhouse gas emissions – centres of culture, theatre, music, dance, fun....
Imagination to see potential of cities for
City governments with the bravery to engage
– Civil servants and politicians who see the dynamism and capacity of low-income groups and migrants and their potential as partners
City governments that build into development
African, Asian and Latin American cities to show
Bosnia & Herzegovena Mauritius Slovenia Belize Syrian AR Georgia Hong Kong, China Singapore Belgium Kuwait Israel Uruguay Venezuela Argentina Chile Lebanon New Zealand UK Australia Denmark Sweden Canada Netherlands USA Norway Switzerland Jordan Brazil Gabon Saudi Arabia Korea, Rep UAE Spain Germany France Czech Rep Mexico Russian Fed Colombia Peru Estonia Lithuania Italy Austria Japan Finland Hungary Poland Bolivia Turkey Armenia Malaysia Ireland Greece Costa Rica South Africa Croatia Slovakia Ecuador Congo Botswana Nigeria Guatemala Indonesia Egypt Burundi Trinidad and Tobago Uganda Sri Lanka Swaziland India Guyana Cambodia Lao, PDR Bangladesh Vietnam China Namibia Thailand Guinea Pakistan Portugal 20 40 60 80 100 5,000 10,000 15,000 20,000 25,000 30,000 35,000 GDP per capita in 2000 (US$ PPP) Urbanization level in 2000 (%)
Economies of scale and proximity for health