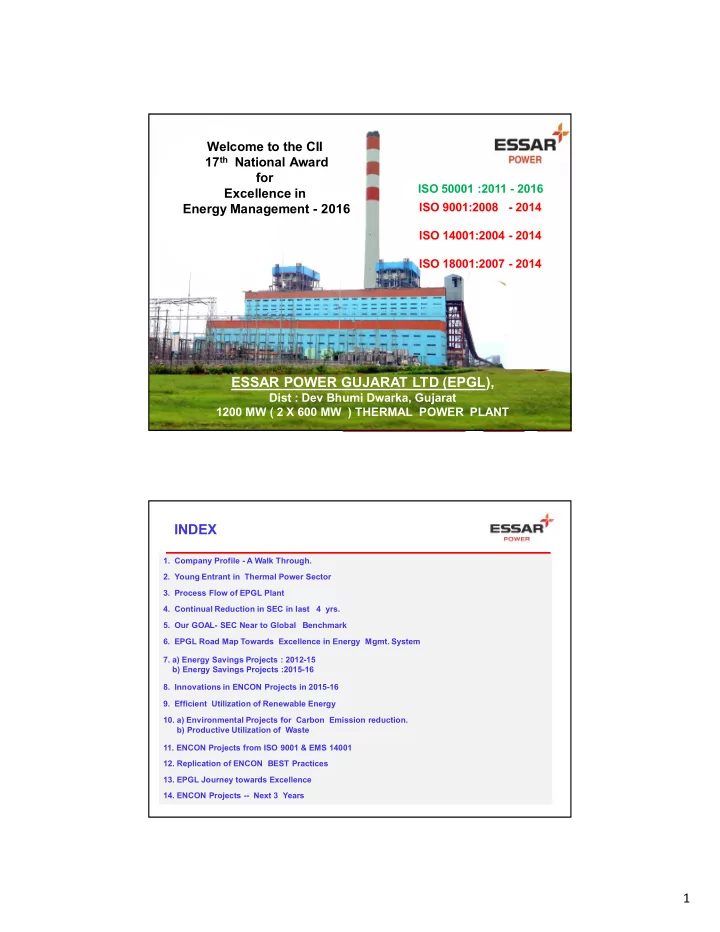
essar power gujarat ltd epgl
play

ESSAR POWER GUJARAT LTD (EPGL), Dist : Dev Bhumi Dwarka, Gujarat - PDF document

Welcome to the CII 17 th National Award for ISO 50001 :2011 - 2016 Excellence in ISO 9001:2008 - 2014 Energy Management - 2016 ISO 14001:2004 - 2014 ISO 18001:2007 - 2014 ESSAR POWER GUJARAT LTD (EPGL), Dist : Dev Bhumi Dwarka, Gujarat


  1. Welcome to the CII 17 th National Award for ISO 50001 :2011 - 2016 Excellence in ISO 9001:2008 - 2014 Energy Management - 2016 ISO 14001:2004 - 2014 ISO 18001:2007 - 2014 ESSAR POWER GUJARAT LTD (EPGL), Dist : Dev Bhumi Dwarka, Gujarat 1200 MW ( 2 X 600 MW ) THERMAL POWER PLANT INDEX 1. Company Profile - A Walk Through. 2. Young Entrant in Thermal Power Sector 3. Process Flow of EPGL Plant 4. Continual Reduction in SEC in last 4 yrs. 5. Our GOAL- SEC Near to Global Benchmark 6. EPGL Road Map Towards Excellence in Energy Mgmt. System 7. a) Energy Savings Projects : 2012-15 b) Energy Savings Projects :2015-16 8. Innovations in ENCON Projects in 2015-16 9. Efficient Utilization of Renewable Energy 10. a) Environmental Projects for Carbon Emission reduction. b) Productive Utilization of Waste 11. ENCON Projects from ISO 9001 & EMS 14001 12. Replication of ENCON BEST Practices 13. EPGL Journey towards Excellence 14. ENCON Projects -- Next 3 Years 1

  2. 1. COMPANY PROFILE : ESSAR POWER GUJARAT LTD. Location Salaya, Dev Bhumi Dwarka District, Gujarat Capacity 1200 MW (2 x 600 MW) Fuel Imported Thermal Coal • Sub-Critical Technology Technology / • BTG Package- HEI , China Equipment • BOP- Reputed Vendors ( ABB/Areva/SPIG ) • 1000 MW - Long term PPA with GUVNL Power Off-take • Balance 118 MW - Merchant Power • Presently 64 MLD River water Water • Future-Sea Water - 9375 m3/hr Requirement Power • Evacuation at 400 KV – STU Network Evacuation 2. YOUNG ENTRANT IN THERMAL POWER UNIT-1 COD : 01 st April 2012 UNIT-2 COD : 15 th June 2012 New Entrant … . Just 4 Years PLANT OVERVIEW Boiler Area Essar Power Gujarat Ltd 2

  3. 3. PROCESS FLOW DIAGRAM 4. CONTINUAL REDUCTION IN SEC IN LAST 4 YRS. OPERATIONAL PERFORMANCE YOY Improvement • Good and Consistent O&M practices 90% 7000 6609 MU 80% 6000 5387 MU 70% 5229 MU 5000 4093 MU 60% 4000 GHR 50% GHR GHR 2451 GHR 2421 40% 80% 2339 3000 73% 2333 71% 69% GHR - 2423 30% AT GHR - 2385 2000 GHR - 2339 Normative GHR - 2315 20% Loading 1000 7.15% 6.60% 6.06% 10% 5.83% 6.85% 6.3% 5.83 % 5.76% 0% 0 FY 2012-13 FY 2013-14 FY 2014-15 FY 2015-16 Plant Loading Factor (%) Auxiliary Consumption (%) Generation (MU) 3

  4. 5. OUR GOAL: SEC NEAR TO GLOBAL BENCHMARK • HEAT RATE ( Kcal / Kwh ) Gross Heat Rate ( GHR ) CONTINUAL IMPROVEMENT & EXCELLENCE FY 2012-13 FY 2013-14 FY 2014-15 FY 2015-16 CERC NORM 2451 2421 2339 2333 2375 Kcal /kwh Specific Oil Consumption • Specific Oil Consumption ( ml / kwh) 2012-13 2013-14 2014-15 2015-16 CERC NORM ML/ kwh 1.8 0.32 0.23 0.28 0.5 ML / kwh KL /Start 189 102 67 54 Annual O&M Cost ( Rs in Lac / MW ) • DM WATER MAKE UP ( % ) O&M 2012-13 2013-14 2014-15 2015-16 Norm 12.1 13.3 14.4 15.3 CERC NORM Actual 11.2 10.8 11.3 13.4 15.3 Rs Lac / MW Aux Consumption ( % ) • AUX POWER ( % ) 2012-13 2013-14 2014-15 2015-16 CERC NORM Aux Cons. 7.1 6.6 5.8 6.0 5.75 % Loading 71% 69% 80% 73% DM WATER CONSUMPTION TREND 800 2.40 669 700 2.20 615 592 600 552 2.00 552 464 1.80 500 451 416 431 515 1.60 MU 400 % Top Few 424 Power 1.40 300 Stations 1.26 1.20 1.06 1.23 0.94 200 0.99 1.00 0.99 0.91 0.70 0.68 100 0.80 0.63 0.82 62 0.77 0.60 0 Specific DM consumption (%) Generation (MU) 4

  5. 6. EPGL ROAD MAP TOWARDS EXCELLENCE IN ENERGY MANAGEMENT Baseline Actual Designated Target Net Heat Rate Net Heat Rate Consumer Net Heat rate Consumption FY 2016-17 (PAT-2) 2018-19 2014-15 ( YTD till July ‘ 16) STATION (Kcal/Kwh) (Kcal/Kwh) (Kcal/Kwh) ESSAR POWER 2512 2506 2497 GUJARAT LIMITED INGRAINED IN CULTURE : EVERY KCAL COUNTS - MEASURED DAILY • CHALLENGING SELF – ENCON OBJECTIVE IN IMS • ALIGNED TO TECHNOLOGICAL DEVELOPMENT • BENCHMARKING WITH BEST IN INDUSTRY • ZERO TOLERANCE TO INEFFICIENT EQUIPMENTS ESSAR POWER GUJARAT LTD - ENERGY POLICY Opportunities Register *Priority No. (Greater the Acti Identifi number = Energy Sr. Date of on Plant/ Area/ ed Opportunity Implementabl higher the Wastage*/ If Yes, Describe Target Completion N Identificat A B C D Plan Unit Activity Energy e (Yea/No) priority) Energy benefit Date date/Status O. ion ref Use Priority Loss no. Number Calculation To start from Heat Improvement Major annual 25 Feb 2016 Energy 1 Oct-15 EPGL Turbine (Kcal/k in turbine Yes 4 3 3 3 108 overhauling of Apr-16 3 and to Loss wh) performance Unit-2 Turbine complete in 50 Days 1) Increase in No. of fan blades Vaccum 2) Increasing improve Improvement height of ment by Heat in condenser Energy recovery cone 12.5 % 2 May-15 EPGL Cooling (Kcal/k Yes 4 2 3 3 72 Oct-16 1 vaccum and Loss 3) Nozzle completion Tower wh) heat rate replacement modifica with new tion design 4) Structure strengthening Conden 1) Installation of Technical Electric sate Reduction in Energy VFD in CEPs Discussion 3 Dec-15 EPGL al Yes 4 2 3 3 72 Feb-17 2 extractio Energy use Loss for reduction in under power n pumps energy use progress Technical Electric Reduction of Installation of Dec-15 EPGL Seal Air Energy Aug- Discussion 4 al Electrical Yes 3 2 3 3 54 VFD in seal air 8 Fan Loss 16 under power energy fans progress Electric Reduction in Under LED Energy Under 5 Aug-15 EPGL al Light Yes 2 2 2 3 24 ImplementationJun-16 4 Implementati Lighting Loss power consumption on Electric Decision after Feasibility Feasibility Reduction in Energy 6 Feb-16 EPGL AHP al feasibility study under study under Energy use Loss power study progress progress Non conventi onal energy Heat Reduction Decision after Feasibility Party visted usage Energy 7 Sep-15 EPGL (Kcal/k plant heat feasibility 0 study under 5 site. Offer for Loss wh) rate study progress awaited heating of condens ate Solar Electric Use of Solar Decision after Feasibility Party visted Energy 8 Sep-15 EPGL Street al Energy for feasibility 0 study under 6 site. Offer Loss Lights power street lights study progress awaited Rev. Date: Doc. No: EPGL/EnMS/F/025 Rev. No: 01 20-02-2016 5

  6. OUR BELIEF … ENERGY CONSERVATION. A TEAM EFFORT …… . E MD COO HOD MGR ENGR T Target N E Evaluate Options E R Analyze and Apply G A Y Monitor and Maintain M C 21 Energy Auditors / Managers O N ENCON --- Driven across Levels ENERGY MANAGEMENT SYSTEM & REPORTING AUTOMATED DAILY EFFY. REPORT Continuously Collating HMBD with Actual Data For Timely Intervention 6

  7. 7 A. Summary- Energy Savings ( MU / Annum ) FY 2012-15 S. No Energy Conservation Projects Cost Incurred Energy Saving (Rs in Lacs) MU/Annum 1 Coal Mill Utilization None 3.50 2 Plant Air compressor None 2.41 3 Coal conveying system None 0.13 4 Ash Handling system None 1.28 5 DM Hot well pump None 0.1 6 Compressor cooling system None 0.35 7 Lighting Load Optimization None 0.06 TOTAL SAVINGS ( MU ) 7.83 A Energy Saving M Kcal/Annum 1 HP Exhaust Valve modification None 52872 2 Turbine Operation Philosophy None 99135 3 Start Up Oil reduction None 19088 TOTAL SAVINGS ( MKCAL ) 171095 B A+B :Total Savings (Rs in Lacs) 1648 7 B. Summary- Energy Savings ( MU / Annum ) FY 2015-16 Sr. Cost Energy Total savings Incurred Saving (INR Lacs) No ENCON Projects (INR Lacs) /Annum 1 Pre- Ponment of Turbine Capital 340 115500 Mkcal 850 Overhaul Condenser Vacuum Improvement – 2 Up 200 24000 Mkcal 200 gradation of Cooling tower 3 Boiler DM make up reduction. Nil 72160 Mkcal 600 4 Specific oil reduction during Boiler Nil 432 KL 150 startup. ( 9 X 48 KL) 5 Optimization of SEC - AHP None 1.06 MU 21.2 6 Optimization of SEC - CHP None 0.105 MU 2.1 7 Optimization of SEC - Chlorination None 0.13 MU 2.5 System. 8 LED Lighting installation 11.5 0.10 MU 2.0 Total Savings (INR Lacs) 1827.8 ENERGY SAVING CALCULATED AT NORMATIVE LOAD AND OVER BASELINE OF 2012-13 7

  8. 8. Innovations in ENCON Projects in 2015-16. Innovation-1: Pre-ponement of Unit 2 Capital Overhaul Overview - • Preponing Turbine capital overhaul for heat rate improvement. • Details- • Turbine COH without OEM support • Shutdown executed in 37 days against schedule of 55 days • Improvement of GHR by 35 Kcal/kwh • Steam path audit – Third Party Expert • Major jobs executed are : • Optimised Steam flow path clearances • Use of Fresh seals with intact profile • Rectification of identified problems • Rotor cleaning • Routine Maintenance. Total Energy Savings = 1,15,500 MKcal / Annum Innovation-1: Pre-ponement of Capital Overhaul SUBSTANTIAL Heat Loss Recovery – Casing wise HEAT RATE 57.1 IMPROVEMENT OPENING CLOSING 37.2 2050 2040 202 19.8 19.1 17.0 5 2030 2.1 5.6 1.9 3.7 9.3 3.5 5.8 9.1 4.7 4.4 7.8 4.2 3.5 6.3 3.4 2.8 2020 HPT IPT LPT-1 (T) LPT-1 (G) LPT-2 (T) LPT-2 (G) TOTAL 2010 Heat Loss Recovery – Category wise 2000 1990 1990 56.8 OPENING CLOSING 1980 36.9 26.6 1970 19.9 15.5 14.5 3.7 2.8 1.0 5.0 9.4 11.8 1.0 10.8 11.1 0.2 0.0 0.2 1960 Turbine Heat Rate before COH INTERSTAGE TIP SPILL SHAFT END SURFACE COVER TOTAL Turbine Heat PACKING STRIPS PACKINGS ROUGHNESS DEPOSITS Rate after COH 8

Download Presentation
Download Policy: The content available on the website is offered to you 'AS IS' for your personal information and use only. It cannot be commercialized, licensed, or distributed on other websites without prior consent from the author. To download a presentation, simply click this link. If you encounter any difficulties during the download process, it's possible that the publisher has removed the file from their server.

Recommend


More recommend