SLIDE 1
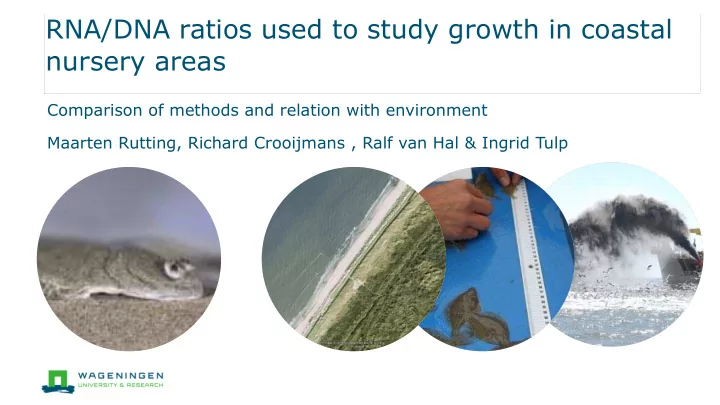
RNA/DNA ratios used to study growth in coastal nursery areas
Comparison of methods and relation with environment Maarten Rutting, Richard Crooijmans , Ralf van Hal & Ingrid Tulp
SLIDE 2 Living below sea level...
2
SLIDE 3 Regular nourishments since 1991
3
SLIDE 4
Sand nourishments and nurseries
SLIDE 5 Impact on nursery function?
§ Knowledge on the impact:
- Benthic community restores
within a year after sand nourishment
- Effects on fish community?
- Effects on the nursery
function? =>fish growth?
SLIDE 6 June 2017: multidisciplinary survey
§ Wageningen Marine Research § Multidisciplinary survey § Animal Breeding & Genetics
Richard Crooijmans
6
MSC Maarten Rutting: Fish growth RNA/DNA
SLIDE 7
Locations
§ Location 1: Zuid-Holland § Location 2: Noord-Holland § Location 3: Texel § Location 4: Ameland
=>4 consecutive weeks from South to North
SLIDE 8 Transects: fish sampling
8
§ Transects per location § Fish sampling:
- 0-1 m: walking push net
- 2-3 m: dinghy: 2 m beam
- 3-10 m: vessel 3 m beam
§ Stratification based on sediment § Continuous recording abiotics § Benthos sampling
SLIDE 9
Aim MSc project
§ compare methods to measure
RNA:DNA ratio’s
§ Investigate growth juvenile flatfish in
June in nurseries along the Dutch coast
§ Growth ~ related to abiotic factors? § Relation with sand nourishments:
role of sediment?
SLIDE 10
Survey - Benthos
SLIDE 11
Survey - Sediment
SLIDE 12
Survey - Fish
SLIDE 13 Tissue collection
§ starting points
- For tissue collection:
- Directions from
Benjamin Ciotti (thanks!)
- For isolation:
- Protocol and Guide for Estimating
Nucleic Acids in Larval Fish Using a Fluorescence Microplate Reader (Caldarone, et al., 2001)
SLIDE 14 RNA/DNA Quantification: two methods
§ Ethidium bromide § Qubit Fluorometer
- Already used before to analyse RNA:DNA ratio’s
- Using
- RNA High Sensitivity Assay Kit (Invitrogen™)
- dsDNA High Sensitivity Assay Kit (Invitrogen™)
SLIDE 15
RNA/DNA Quantification
Add RNAse + Incubation 30 min Add Ethidium bromide Measure #1 Add Qubit DNA- and RNA dye Measure Measure #2 Incubation 2 min Calculate fluorescence for DNA Qubit Quantifies RNA and DNA + Correction for sample input Quantify RNA and DNA
SLIDE 16 Qubit range
§ Ideally
(20 µl)
fall in the middle of the range
§ Possible for DNA § Not possible for RNA
Ø
Dilution required
100 200 300 400 500 600
200 400 600
Fluorescence Concentration (ng/ml)
Schematic overview of the Qubit range
SLIDE 17 5 10 15 20 25 10 20
Calculated Qubit RNA ng µl -1
Sample in Qubit (µl)
Dilution effect
§ Using less sample volume:
§ Correction needed for
diluting
§ Dilution series to produce
corrections for diluting
Dilution direction
SLIDE 18 Method comparison
Ethidium Bromide Qubit 1 2 3 4 5 6 7 RNA:DNA
2 4 6 8 2 4 6 8 RNA:DNA Ethidium Bromide RNA:DNA Qubit
SLIDE 19 Location differences
1 2 3 4 1 2 3 4 5 6 7 Location RNA:DNA
Sole
1 2 3 4 1 2 3 4 5 6 7 Location RNA:DNA
Dab
1 2 3 4 1 2 3 4 5 6 7 Location RNA:DNA
Plaice
N: 48 103 74 77 N: 17 33 23 5 N: 76 120 109 87
SLIDE 20 Factors considered
- Temperature
- Salinity
- Depth
- Tidal phase
- Location
- Sediment grain size
<- No results yet
<- No results yet
- Density of shore crab
- Density of large common shrimp (+30 mm)
- Density of flatfish (highly correlated with shore crab)
SLIDE 21 RNA/DNA~fish length
5 10 15 20 1 2 3 4 5 6 7 Length (cm) RNA:DNA
R 2 = 0.333 p = 2.6e-08
Sole
5 10 15 20 1 2 3 4 5 6 7 Length (cm) RNA:DNA
R 2 = 0.232 p = 5.6e-19
Dab
5 10 15 20 1 2 3 4 5 6 7 Length (cm) RNA:DNA
R 2 = 0.000231 p = 0.76
Plaice
locations: 1 (ο) 2 (∆) 3 (+) 4 (×)
SLIDE 22 RNA/DNA~fish length
5 10 15 20 1 2 3 4 5 6 7 Length (cm) RNA:DNA
R 2 = 0.232 p = 5.6e-19
Dab
1 2 3 4 5 6 1 2 3 4 5 6 7 Length (cm) RNA:DNA
R 2 = 0.199 p = 1.8e-10
Dab 0-group
locations: 1 (ο) 2 (∆) 3 (+) 4 (×)
SLIDE 23 RNA/DNA~salinity
28 30 32 34 36 1 2 3 4 5 6 7 Salinity (ppt) RNA:DNA
R 2 = 0.015 p = 0.28
Sole
28 30 32 34 36 1 2 3 4 5 6 7 Salinity (ppt) RNA:DNA
R 2 = 0.239 p = 1.5e-19
Dab
28 30 32 34 36 1 2 3 4 5 6 7 Salinity (ppt) RNA:DNA
R 2 = 0.0148 p = 0.016
Plaice
locations: 1 (ο) 2 (∆) 3 (+) 4 (×)
SLIDE 24 Preliminary analysis
factor plaice dab dab 0 group sole
fish length
ns
ns
salinity
+ ns
water visibility
ns ns
density shore crab
ns ns
density large brown shrimp
ns
ns
Locations (factor)
ns s s ns
SLIDE 25 § Qubit suitable to measure RNA/DNA § range RNA high sensitivity kit too limited to accurately quantify RNA in
fastest growing juveniles
=>Solution: Qubit™ RNA Broad Range Assay Kit
§ Seasonal effect ~ location effect § Variation in RNA/DNA related to several (a)biotic factors § Negative effect epibenthic predators § Location and salinity confounding § Relation with sediment: still too be included in analysis
Discussion
25
SLIDE 26
Future work
§ Include sediment data § Refine Qubit method § Next step: collecting fish later in the
year, when food becomes limiting and growth is reduced
SLIDE 27 Thanks for listening
Questions (not too technical J)
27
SLIDE 28 Discussion: Qubit vs Ethidium bromide
Pros:
- Measure both DNA and RNA
- Easy to use, less steps
involved that influence
- utcome
- No enzymatic steps required
- safer to use and requires
less training
- possible to use the kits with
a Fluorometric plate reader
Cons:
- range RNA high sensitivity
kit too limited to accurately quantify RNA in fastest growing juveniles =>Solution: Qubit™ RNA Broad Range Assay Kit
sensitive to dilution
28
SLIDE 29 Shore crab Density
0.00 0.02 0.04 0.06 1 2 3 4 5 6 7 Shore crab m−2 RNA:DNA R 2 = 0.13 p = 0.0012
Sole
0.00 0.02 0.04 0.06 1 2 3 4 5 6 7 Shore crab m−2 RNA:DNA R 2 = 0.00339 p = 0.31
Dab
0.00 0.02 0.04 0.06 1 2 3 4 5 6 7 Shore crab m−2 RNA:DNA R 2 = 0.052 p = 5.1e-06
Plaice
locations: 1 (ο) 2 (∆) 3 (+) 4 (×)
SLIDE 30 RNA/DNA~temperature
16 17 18 19 20 21 22 1 2 3 4 5 6 7 Temperature ( ° C) RNA:DNA
R 2 = 0.0961 p = 0.0054
Sole
16 17 18 19 20 21 22 1 2 3 4 5 6 7 Temperature ( ° C) RNA:DNA
R 2 = 0.0532 p = 5.2e-05
Dab
16 17 18 19 20 21 22 1 2 3 4 5 6 7 Temperature ( ° C) RNA:DNA
R 2 = 0.011 p = 0.038
Plaice
locations: 1 (ο) 2 (∆) 3 (+) 4 (×)