Results of Cascade Road Diet: Background Before data set was - - PowerPoint PPT Presentation

results of cascade road diet background
SMART_READER_LITE
LIVE PREVIEW

Results of Cascade Road Diet: Background Before data set was - - PowerPoint PPT Presentation

Results of Cascade Road Diet: Background Before data set was collected on 1/18/18, and After data collected on 11/27/18 Cascade was re-striped on 8/15/18 This is the Total Traffic Volume Distribution Through ONE in January of


slide-1
SLIDE 1
  • “Before” data set was collected on 1/18/18, and “After” data collected on 11/27/18
  • Cascade was re-striped on 8/15/18
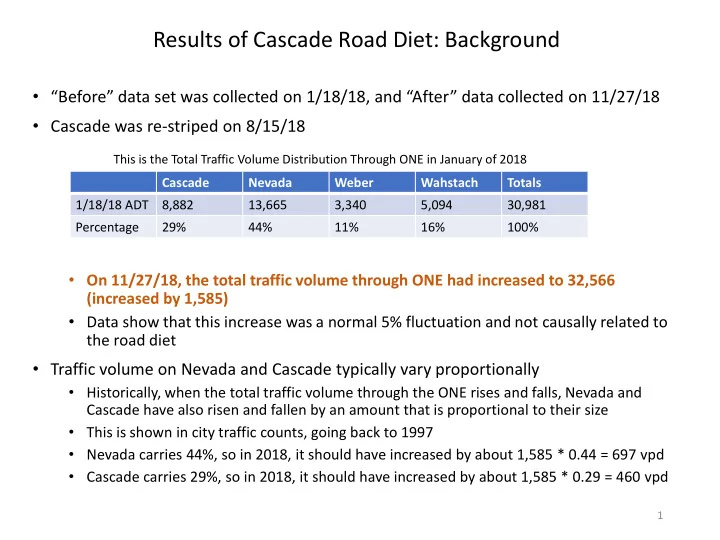
  • On 11/27/18, the total traffic volume through ONE had increased to 32,566

(increased by 1,585)

  • Data show that this increase was a normal 5% fluctuation and not causally related to

the road diet

  • Traffic volume on Nevada and Cascade typically vary proportionally
  • Historically, when the total traffic volume through the ONE rises and falls, Nevada and

Cascade have also risen and fallen by an amount that is proportional to their size

  • This is shown in city traffic counts, going back to 1997
  • Nevada carries 44%, so in 2018, it should have increased by about 1,585 * 0.44 = 697 vpd
  • Cascade carries 29%, so in 2018, it should have increased by about 1,585 * 0.29 = 460 vpd

Results of Cascade Road Diet: Background

1

Cascade Nevada Weber Wahstach Totals 1/18/18 ADT 8,882 13,665 3,340 5,094 30,981 Percentage 29% 44% 11% 16% 100% This is the Total Traffic Volume Distribution Through ONE in January of 2018

slide-2
SLIDE 2
  • Traffic Volume
  • Change in the total number of vehicles is marginal
  • Small increase north of Fontanero, and small decrease south
  • This occurred during substantial increase in traffic volume across the ONE
  • 1,585 * 0.29 = 460 vehicles should have been added : 460 + 68 = 528 were diverted
  • Speed Distribution
  • Shifted approx. 5 mph to lower speed
  • Before Road Diet, there were 970 vehicles above 45 mph, and 62 over 55 mph
  • After Road Diet, there were 92 over 45 mph and 0 over 55
  • Still, nearly everyone is above the speed limit – they are not badly inconvenienced

Results of Cascade Road Diet: Cascade

2 Location Before Road Diet After Road Diet Change South of Fontanero 8,882 8,814

  • 68

Cascade Traffic Volume (Vehicles per Day)

  • 500

500 1000 1500 2000 2500 3000 3500 4000 4500 10 20 30 40 50 60 70

Number of Cars Speed (mph)

Speed Changes on Cascade after Road Diet

Cascade S Before Cascade S After

Speed Limit

On Cascade (south of Fontanero), there were 68 fewer vehicles after the road diet, despite substantial growth elsewhere through the Old north End

This is fantastic!

slide-3
SLIDE 3
  • Traffic Volume
  • Substantial growth in the number of vehicles
  • 8.0% more south of Fontanero
  • This is well beyond the measurement uncertainty
  • We conclude that there has been significant diversion to Nevada
  • While Nevada typically carries 44% of the N/S burden, it took on 72% of the growth
  • Expect growth to be 1,585 * 0.44 = 697 vehicles, 1,091 – 697 = 394 extra vehicles

beyond expected growth

  • Speed Distribution
  • Very few cars are actually going slower
  • The lower mean speed can be accounted for by increase in traffic volume
  • Speed limit reduction (from 35 to 30 mph) had no measurable effect
  • Distribution is a bit broader, which means cars interact more (some slow, some fast)
  • This is a more dangerous situation

Results of Cascade Road Diet: Nevada

3 Location Before Road Diet After Road Diet Change South of Fontanero 13,665 14,756 +1,091

Nevada Traffic Volume (Vehicles per Day)

  • 1000

1000 2000 3000 4000 5000 6000 7000 10 20 30 40 50 60 70

Number of Cars Speed (mph)

Speed Changes on Nevada after Road Diet

Nevada N before Nevada N After

slide-4
SLIDE 4
  • Traffic Volume
  • Changes on Wood & Tejon (adjacent to Cascade) are statistically insignificant
  • This conclusively demonstrates that Cascade road diet does not divert

cars to two-lane roads

  • Wahsatch (like Nevada) took on more than its proportional share (427 vs 253)

Results of Cascade Road Diet: Other North/South Streets

4

Location Before Road Diet After Road Diet Change Wood 547 554 +7 Tejon 598 552

  • 46

Weber 3,340 3,476 +136 Wahsatch 5,093 5,520 +427

Traffic Volume (Vehicles per Day)