
SLIDE 1
Relationships between Nighttime Imagery Relationships between - - PowerPoint PPT Presentation
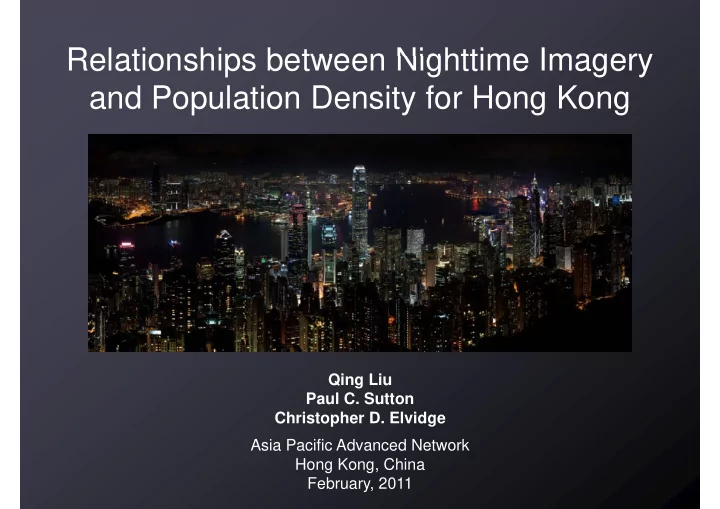
Relationships between Nighttime Imagery Relationships between Nighttime Imagery and Population Density for Hong Kong p y g g Qing Liu P Paul C. Sutton l C S tt Christopher D. Elvidge Asia Pacific Advanced Network Hong Kong, China
Cloud-free composite derived DMSP-OLS data collected at low, medium and high gain settings. 30 arc-second grid or approximately 1 km2 at the equator
Spatial Resolution: approximately 90m, estimated to be 6m per pixel
US Laboratory Department of Energy, Oak Ridge National Laboratory Representing ambient population count per cell 30 arc-second grid or approximately 1 km2 at the equator
LandScan, DMSP-OLS, ISS red, ISS green, ISS blue, ISS PC1
North Tuen Mun Hong Kong International Airport C t l & W t Kwun Tong Central & West Wan Chai Eastern Islands
North Tuen Mun Hong Kong International Airport C t l & W t Kwun Tong Central & West Wan Chai Eastern Islands
The finer spatial and spectral resolution of the ISS photographs does not increase correlation between nighttime lights and measures of l ti l ti d it population or population density.