Satellite IR Imagery 00Z 09Z 18Z Infrared satellite imagery for - - PowerPoint PPT Presentation

satellite ir imagery
SMART_READER_LITE
LIVE PREVIEW

Satellite IR Imagery 00Z 09Z 18Z Infrared satellite imagery for - - PowerPoint PPT Presentation

Satellite IR Imagery 00Z 09Z 18Z Infrared satellite imagery for Nov. 10, 1998, based on radiation in the 10.7 m window channel . Radiances are indicative of equivalent blackbody tempera- tures T E . Colour is used to enhance the prominence


slide-1
SLIDE 1

Satellite IR Imagery

00Z 09Z 18Z

Infrared satellite imagery for Nov. 10, 1998, based on radiation in the 10.7µm window channel.

Radiances are indicative of equivalent blackbody tempera- tures TE. Colour is used to enhance the prominence of the coldest (highest) cloud tops in the image.

slide-2
SLIDE 2

Satellite IR image and weather reports, 00 UCT, 10 November, 1998.

2

slide-3
SLIDE 3

Satellite IR image and weather reports, 09 UCT, 10 November, 1998.

3

slide-4
SLIDE 4

Satellite IR image and weather reports, 18 UCT, 10 November, 1998.

4

slide-5
SLIDE 5

Note the pronounced lowering of the cloud top tempera- tures along the leading edge of the cold frontal cloud band between 00 and 18 UTC. This is indicative of the deepening of the convection.

5

slide-6
SLIDE 6

Note the pronounced lowering of the cloud top tempera- tures along the leading edge of the cold frontal cloud band between 00 and 18 UTC. This is indicative of the deepening of the convection. The remnants of the cloud band that was over the Texas Panhandle at 00 UTC have become aligned with the sec-

  • ndary cold front.

5

slide-7
SLIDE 7

Note the pronounced lowering of the cloud top tempera- tures along the leading edge of the cold frontal cloud band between 00 and 18 UTC. This is indicative of the deepening of the convection. The remnants of the cloud band that was over the Texas Panhandle at 00 UTC have become aligned with the sec-

  • ndary cold front.

In the final image, taken at 18 UT, the “yin-yang pattern” in the vertical velocity field is clearly evident.

5

slide-8
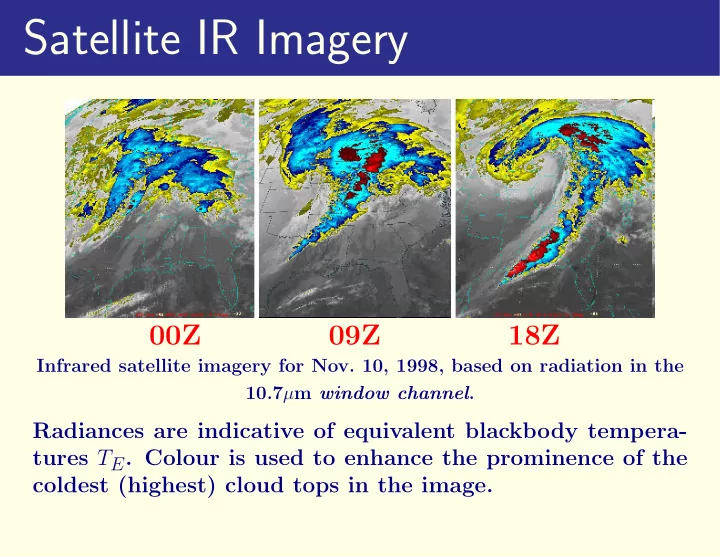
SLIDE 8

Note the pronounced lowering of the cloud top tempera- tures along the leading edge of the cold frontal cloud band between 00 and 18 UTC. This is indicative of the deepening of the convection. The remnants of the cloud band that was over the Texas Panhandle at 00 UTC have become aligned with the sec-

  • ndary cold front.

In the final image, taken at 18 UT, the “yin-yang pattern” in the vertical velocity field is clearly evident. The “chimney” of clouds emanating from the band of con- vection along the cold front curves cyclonically around the north side of the cyclone and spirals inward around its west- ern flank, where heavy snow is falling at this time.

5

slide-9
SLIDE 9

Shapiro and Keyser (1990) have described bent-back occlusions in terms of their “T-Bone structure”.

6

slide-10
SLIDE 10

The pronounced current of subsiding air, called the dry slot, is wrapping around the southern flank of the cyclone, bring- ing an end to the precipitation in the areas immediately to the south and east of it.

7

slide-11
SLIDE 11

The pronounced current of subsiding air, called the dry slot, is wrapping around the southern flank of the cyclone, bring- ing an end to the precipitation in the areas immediately to the south and east of it. Remnants of the warm frontal cloud band can still be seen advancing northeastward ahead of the system, but they are becoming increasingly detached from the circulation around the cyclone.

7

slide-12
SLIDE 12

The pronounced current of subsiding air, called the dry slot, is wrapping around the southern flank of the cyclone, bring- ing an end to the precipitation in the areas immediately to the south and east of it. Remnants of the warm frontal cloud band can still be seen advancing northeastward ahead of the system, but they are becoming increasingly detached from the circulation around the cyclone. This sequence of development is very much in accord with the typical cloud pattern observed in association with deep extratropical cyclones.

7

slide-13
SLIDE 13

Water Vapour Imagery

00Z 09Z 18Z

Satellite imagery for Nov. 10, 1998, based on radiation in the 6.7µm water-vapour channel.

8

slide-14
SLIDE 14

Satellite imagery for the water vapour channel yields addi- tional insights into the structure and evolution of the storm. Radiances in this band are indicative of the mid-tropospheric humidity.

9

slide-15
SLIDE 15

Satellite imagery for the water vapour channel yields addi- tional insights into the structure and evolution of the storm. Radiances in this band are indicative of the mid-tropospheric humidity. Air that has been rising tends to be moist, resulting in a high optical depth, a low equivalent blackbody temperature and a low radiance, and vice versa.

9

slide-16
SLIDE 16

Satellite imagery for the water vapour channel yields addi- tional insights into the structure and evolution of the storm. Radiances in this band are indicative of the mid-tropospheric humidity. Air that has been rising tends to be moist, resulting in a high optical depth, a low equivalent blackbody temperature and a low radiance, and vice versa. Low radiances, indicative of ascent are rendered by the ligher grey shades and high radiances, indicative of sub- sidence, by the darker shades. Clouds with high tops are also visible.

9

slide-17
SLIDE 17

Satellite IR and WV images for 00 UCT, 10 November, 1998.

10

slide-18
SLIDE 18

Satellite IR and WV images for 09 UCT, 10 November, 1998.

11

slide-19
SLIDE 19

Satellite IR and WV images for 18 UCT, 10 November, 1998.

12

slide-20
SLIDE 20

IR Satellite Sequence 0915Z – 1815Z (hourly)

We now look at a sequence of infra-red satellite images made

  • n 10th November, 1998.

The images are from the GOES-8 geostationary satellite, at hourly intervals. They are in the 10.7µm band. The higher (colder) clouds are colour-coded for emphasis.

13

slide-21
SLIDE 21

14

slide-22
SLIDE 22

15

slide-23
SLIDE 23

16

slide-24
SLIDE 24

17

slide-25
SLIDE 25

18

slide-26
SLIDE 26

19

slide-27
SLIDE 27

20

slide-28
SLIDE 28

21

slide-29
SLIDE 29

22

slide-30
SLIDE 30

23

slide-31
SLIDE 31

Radar Imagery

Radar image at 0620 UTC, Nov. 10, 1998.

24

slide-32
SLIDE 32

Radar imagery confirms the existence of a narrow, persis- tent band of deep convection along the advancing cold front, a feature known as a squall line. Estimated rainfall rates increase by about a factor of five from the faintest echoes, rendered in light blue, to the strong- est echoes, rendered in red. Rainfall rates are heaviest along the leading edge of the band and trail off gradually behind it. ⋆ ⋆ ⋆

25

slide-33
SLIDE 33

Radar imagery confirms the existence of a narrow, persis- tent band of deep convection along the advancing cold front, a feature known as a squall line. Estimated rainfall rates increase by about a factor of five from the faintest echoes, rendered in light blue, to the strong- est echoes, rendered in red. Rainfall rates are heaviest along the leading edge of the band and trail off gradually behind it. ⋆ ⋆ ⋆ The hourly surface reports for Springfield, Missouri, located just to the east of the position of the squall line at 0620 UTC, are shown next.

25

slide-34
SLIDE 34

Hourly surface reports for Springfield Missouri (KSGF).

Springfield reported thunder at 04 and 05 UTC and then again at 07 and 08 UTC. Some time between the 07 and 08 observations the tem- perature dropped by 7◦C and the pressure rose by nearly 4 hPa, signaling a strong cold frontal passage. The most pronounced shift in the wind (from SSW to WSW) did not

  • ccur

at Springfield until the passage

  • f the secondary cold front

around two hours later.

26

slide-35
SLIDE 35

Radar Sequence 0620Z – 0705Z

27

slide-36
SLIDE 36

28

slide-37
SLIDE 37

29

slide-38
SLIDE 38

30

slide-39
SLIDE 39

31

slide-40
SLIDE 40

32

slide-41
SLIDE 41

33

slide-42
SLIDE 42

34

slide-43
SLIDE 43

35

slide-44
SLIDE 44

36

slide-45
SLIDE 45

37

slide-46
SLIDE 46

Radar Image, 1535 UTC

The radar image shown next, based on data taken at 15.35 Z, still exhibits a well defined squall line virtually coincident with the position of the primary cold front. The major features in the distribution of radar echoes mir- ror the patterns in the satellite imagery. The comma-shaped cloud band stretching from the southern tip of the squall line and wrapping around the poleward flank of the cyclone is evident on both images.

38

slide-47
SLIDE 47

Radar Image, 1535 UTC

The radar image shown next, based on data taken at 15.35 Z, still exhibits a well defined squall line virtually coincident with the position of the primary cold front. The major features in the distribution of radar echoes mir- ror the patterns in the satellite imagery. The comma-shaped cloud band stretching from the southern tip of the squall line and wrapping around the poleward flank of the cyclone is evident on both images. The slot of dry, relatively cloud free air intruding from the west and wrapping around the equatorward and eastern flank of the cyclone is also evident on both images. This “yin-yang”-like configuration is the signature of inter- twined ascending and descending air currents in the vertical velocity field, as seen earlier.

38

slide-48
SLIDE 48

Radar Image, 1535 UTC

Radar image at 1535 UTC, Nov. 10, 1998.

39

slide-49
SLIDE 49

Satellite Image, 1615 UTC

Satellite IR image at 1615 UTC, Nov. 10, 1998.

40

slide-50
SLIDE 50

Radar Sequence 1530Z – 1615Z

41

slide-51
SLIDE 51

42

slide-52
SLIDE 52

43

slide-53
SLIDE 53

44

slide-54
SLIDE 54

45

slide-55
SLIDE 55

46

slide-56
SLIDE 56

47

slide-57
SLIDE 57

48

slide-58
SLIDE 58

49

slide-59
SLIDE 59

50

slide-60
SLIDE 60

51