
SLIDE 1
From Open Satellite Data To Emergency Response
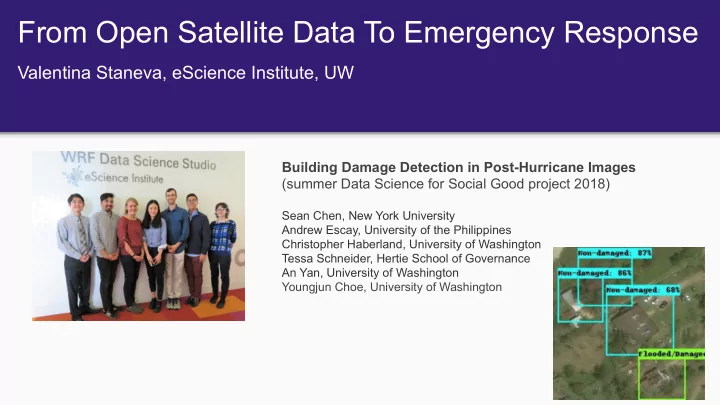
Building Damage Detection in Post-Hurricane Images (summer Data Science for Social Good project 2018)
Sean Chen, New York University Andrew Escay, University of the Philippines Christopher Haberland, University of Washington Tessa Schneider, Hertie School of Governance An Yan, University of Washington Youngjun Choe, University of Washington