
SLIDE 1
Quality ¡Dashboard ¡
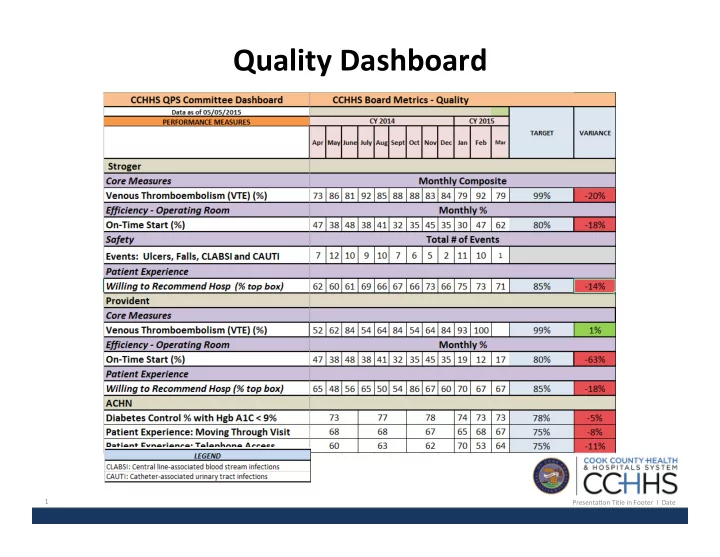
1 ¡ Presenta*on ¡Title ¡in ¡Footer ¡ ¡I ¡ ¡Date ¡ ¡
Quality Dashboard 1 Presenta*on Title in Footer I - - PowerPoint PPT Presentation
Quality Dashboard 1 Presenta*on Title in Footer I Date CCHHS BOARD OF DIRECTORS Focus Report Corporate Compliance May 29, 2015
1 ¡ Presenta*on ¡Title ¡in ¡Footer ¡ ¡I ¡ ¡Date ¡ ¡
2 ¡ Audit ¡& ¡Compliance ¡Commi>ee ¡of ¡the ¡Board ¡ ¡I ¡ ¡May ¡21, ¡2015 ¡ ¡
Review ¡Corporate ¡Compliance ¡Controls ¡of ¡the ¡ CountyCare ¡Health ¡Plan ¡through, ¡
§ CountyCare ¡Oversight ¡MeeIngs ¡ § Grievances ¡and ¡Appeals ¡Monitoring ¡ § Fraud, ¡Waste, ¡and ¡Abuse ¡AcIvity ¡
3 ¡ Audit ¡& ¡Compliance ¡Commi>ee ¡of ¡the ¡Board ¡ ¡I ¡ ¡May ¡21, ¡2015 ¡ ¡
Commi>ees ¡have ¡been ¡established ¡to ¡ensure ¡proper ¡oversight ¡ and ¡monitoring ¡of ¡operaIons, ¡policies ¡and ¡compliance ¡with ¡ contractual ¡terms. ¡
4 ¡
Audit ¡& ¡Compliance ¡Commi>ee ¡of ¡the ¡Board ¡ ¡I ¡ ¡May ¡21, ¡2015 ¡ ¡
56 ¡ 55 ¡ 111 ¡ 4 ¡ 47 ¡ 50 ¡ 16 ¡ 13 ¡ 1 ¡
State ¡Fiscal ¡Year ¡
July ¡2014 ¡– ¡June ¡2015 ¡
Fair ¡ Hearing ¡ External ¡ Independent ¡Review ¡ Expedited ¡ Appeals ¡ Appeals ¡ Grievances ¡ Q1 ¡Total ¡= ¡60 ¡ CC ¡Mbrs ¡= ¡88,894 ¡ Q2 ¡Total ¡= ¡118 ¡ CC ¡Mbrs ¡= ¡96,618 ¡ Q3 ¡Total ¡= ¡175 ¡ CC ¡Mbrs ¡= ¡179,393 ¡ Q4 ¡
5 ¡
The ¡Goal: ¡ ¡ To ¡protect ¡the ¡member ¡in ¡the ¡delivery ¡of ¡healthcare ¡services ¡ through ¡Imely ¡detecIon, ¡invesIgaIon ¡and ¡prosecuIon. ¡
¡
Achieved ¡by ¡establishing: ¡
Waste, ¡and/or ¡Abuse ¡(FWA) ¡acIviIes; ¡
local ¡authoriIes; ¡and ¡
Audit ¡& ¡Compliance ¡Commi>ee ¡of ¡the ¡Board ¡ ¡I ¡ ¡May ¡21, ¡2015 ¡ ¡
6 ¡
§ IniIal ¡onboarding ¡for ¡staff ¡and ¡providers. ¡ § CountyCare ¡workforce ¡training ¡includes: ¡
a>endees: ¡CountyCare ¡staff, ¡third ¡party ¡administrator ¡ (IlliniCare) ¡compliance ¡staff, ¡CCHHS ¡staff ¡with ¡oversight, ¡ Cook ¡County ¡Office ¡of ¡Inspector ¡General ¡(OIIG) ¡
Audit ¡& ¡Compliance ¡Commi>ee ¡of ¡the ¡Board ¡ ¡I ¡ ¡May ¡21, ¡2015 ¡ ¡
7 ¡
§ Define ¡a ¡cohesive ¡process ¡across ¡all ¡delegated ¡vendors ¡with ¡
centralized ¡reporIng ¡to ¡Corporate ¡Compliance ¡and ¡hold ¡vendors ¡
§ Monitor ¡Payment ¡Integrity ¡and ¡Special ¡InvesIgaIons ¡Unit ¡
§ Develop ¡an ¡annual ¡work ¡plan ¡focusing ¡on ¡vulnerable ¡areas/
For ¡example, ¡the ¡2015 ¡work ¡plan ¡includes, ¡
Audit ¡& ¡Compliance ¡Commi>ee ¡of ¡the ¡Board ¡ ¡I ¡ ¡May ¡21, ¡2015 ¡ ¡
8 ¡
Audit ¡& ¡Compliance ¡Commi>ee ¡of ¡the ¡Board ¡ ¡I ¡ ¡May ¡21, ¡2015 ¡ ¡
Q1 ¡Total ¡= ¡0 ¡ Providers* ¡= ¡285 ¡ Mbr ¡= ¡88,894 ¡ Q2 ¡Total ¡= ¡5 ¡ Providers* ¡= ¡318 ¡ Mbr ¡= ¡96,618 ¡ Q3 ¡Total ¡= ¡3 ¡ Providers* ¡= ¡325 ¡ Mbr ¡= ¡179,393 ¡ Q4 ¡
5 ¡ 3 ¡ 0 ¡ 4 ¡ 1 ¡ 1 ¡
State ¡Fiscal ¡Year ¡
July ¡2014 ¡– ¡June ¡2015 ¡
Closed ¡ Rollover ¡ Open ¡
* ¡The ¡Provider ¡count ¡is ¡based ¡upon ¡the ¡Taxpayer ¡Iden0fica0on ¡Number ¡(TIN). ¡ ¡ ¡ ¡ ¡ ¡There ¡is ¡a ¡many ¡to ¡one ¡ra0o. ¡ ¡
9 ¡
Pharmacy ¡“Lock-‑In ¡Program” ¡
§ Designed ¡to ¡detect ¡and ¡prevent ¡abuse ¡of ¡the ¡pharmacy ¡benefit ¡
by ¡restricIng ¡Members ¡to ¡one ¡specific ¡pharmacy ¡for ¡1 ¡year. ¡
§ Referrals ¡come ¡from ¡two ¡sources: ¡ ¡
for-‑Service ¡Program ¡
¡ CountyCare ¡Pharmacy ¡Lock-‑In ¡Program ¡ParIcipants ¡
State ¡Fiscal ¡Year ¡2015 ¡Metrics ¡ Q1 ¡– ¡1 ¡member ¡ Q2 ¡– ¡0 ¡(no ¡members) ¡ Q3 ¡– ¡3 ¡members ¡
Audit ¡& ¡Compliance ¡Commi>ee ¡of ¡the ¡Board ¡ ¡I ¡ ¡May ¡21, ¡2015 ¡ ¡
10 ¡
Audit ¡& ¡Compliance ¡Commi>ee ¡of ¡the ¡Board ¡ ¡I ¡ ¡May ¡21, ¡2015 ¡ ¡
Process ¡flow ¡for ¡claims ¡review. ¡ ¡Goal ¡is ¡uniformity ¡with ¡each ¡ delegated ¡vendor. ¡ ¡FWA ¡processes ¡assure ¡consistency. ¡
11 ¡
Monthly ¡meeIngs ¡are ¡coordinated ¡through ¡Corporate ¡ Compliance ¡and ¡involves ¡CountyCare ¡as ¡a ¡whole. ¡ ¡
§ Agenda ¡topics ¡include ¡review ¡of: ¡
integrity ¡agreements; ¡and ¡
Audit ¡& ¡Compliance ¡Commi>ee ¡of ¡the ¡Board ¡ ¡I ¡ ¡May ¡21, ¡2015 ¡ ¡
12 ¡
Audit ¡& ¡Compliance ¡Commi>ee ¡of ¡the ¡Board ¡ ¡I ¡ ¡May ¡21, ¡2015 ¡ ¡
Prepared for: CCHHS Board of Directors
STEVEN GLASS, EXECUTIVE DIRECTOR, MANAGED CARE MAY 29 2015 MAY 29, 2015
Data as of: 5/4/2015 | Source: Daily Membership (834) File
Change From Prior FYTD'15 Budget or % to Budget/ Key Measures Mar'15 Apr'15 May'15 Month Trend Goal Goal Monthly Membership 153,118 179,393 183,415 2.2% 155,860 117.7% ACA 85,984 92,270 90,491 ‐1.9% 76,869 117.7% FHP 64,494 84,324 90,140 6.9% 74,506 121.0% SPD 2,640 2,799 2,784 ‐0.5% 4,485 62.1% Home/Community Waiver (incl DD) 474 500 501 0.2% LTC 156 161 176 9.3% FYTD Member Months 464,097 643,490 826,905 847,159 97.6% ACA 323,223 415,493 505,984 489,740 103.3% FHP 133,093 217,417 307,557 333,518 92.2%
Gender = 56% Female; 44% Male A F l 32 / M l 30 /
SPD 7,781 10,580 13,364 23,902 55.9%
Average age = Female: 32 y/o; Male: 30 y/o
www.countycare.com | 312.864.8200 | Sponsored by the Cook County Health & Hospitals System.
2
www.countycare.com | 312.864.8200 | Sponsored by the Cook County Health & Hospitals System.
3
www.countycare.com | 312.864.8200 | Sponsored by the Cook County Health & Hospitals System.
4
Source: IL HFS, Greater Chicago Region
FHP/ACA Adults, Greater Chicago Region
Feb'15 Mar'15 # # # % T l ( ) # Change % Change Month Apr'15
FHP/ACA Adults, Greater Chicago Region
Feb'15 Mar'15 # # # % T l ( ) # Change % Change Month Apr'15 # # # % Total Family Health Network
Bernard 213,537 195,996 181,459 13.0% (14,537) ‐7.4% CountyCare Cook County/CCHHS 123,920 149,005 176,597 12.7% 27,592 18.5% Blue Cross Blue Shield Health Care Services Corp. 112,352 142,468 163,530 11.7% 21,062 14.8% Harmony Health Plan WellCare 120,630 119,459 137,257 9.8% 17,798 14.9% Health Plan Sponsoring Organization(s) Month Prior Prior # # # % Total Family Health Network
Bernard 213,537 195,996 181,459 13.0% (14,537) ‐7.4% CountyCare Cook County/CCHHS 123,920 149,005 176,597 12.7% 27,592 18.5% Blue Cross Blue Shield Health Care Services Corp. 112,352 142,468 163,530 11.7% 21,062 14.8% Harmony Health Plan WellCare 120,630 119,459 137,257 9.8% 17,798 14.9% Health Plan Sponsoring Organization(s) Month Prior Prior IlliniCare Health Plan Centene, Inc. 102,208 120,302 134,587 9.7% 14,285 11.9% Meridian Health Plan 87,161 101,595 111,923 8.0% 10,328 10.2% Aetna Better Health Inc. 77,676 94,892 106,144 7.6% 11,252 11.9% Advocate Accountable Care (ACE) Advocate Physician Partners 75,948 83,117 87,162 6.3% 4,045 4.9% SmartPlan Choice (ACE) Presence Health Partners, Independent Phys Alliance of IL 60,162 72,331 72,291 5.2% (40) ‐0.1% d h/ IlliniCare Health Plan Centene, Inc. 102,208 120,302 134,587 9.7% 14,285 11.9% Meridian Health Plan 87,161 101,595 111,923 8.0% 10,328 10.2% Aetna Better Health Inc. 77,676 94,892 106,144 7.6% 11,252 11.9% Advocate Accountable Care (ACE) Advocate Physician Partners 75,948 83,117 87,162 6.3% 4,045 4.9% SmartPlan Choice (ACE) Presence Health Partners, Independent Phys Alliance of IL 60,162 72,331 72,291 5.2% (40) ‐0.1% d h/ MyCare Chicago (ACE) Lurie, Mercy, Norweigan, Swedish/Asian Human Svcs, Erie, Heartland HC, Mercy, Near North, PCC/C4 30,628 47,266 55,496 4.0% 8,230 17.4% Community Care Partners (ACE) NorthShore, Vista, Lake County Health Dept, Erie 37,195 38,854 38,982 2.8% 128 0.3% HealthCura (ACE) Access Community Health Network 20,908 20,380 32,365 2.3% 11,985 58.8% Better Health Network (ACE) St Bernard's, Loretto, South Shore, Roseland/Aunt Martha's, Beloved 11,860 21,292 29,632 2.1% 8,340 39.2% l h l ( C ) l h 2 926 23 0 2 6 0 2 0% 3 9 3 6 6% MyCare Chicago (ACE) Lurie, Mercy, Norweigan, Swedish/Asian Human Svcs, Erie, Heartland HC, Mercy, Near North, PCC/C4 30,628 47,266 55,496 4.0% 8,230 17.4% Community Care Partners (ACE) NorthShore, Vista, Lake County Health Dept, Erie 37,195 38,854 38,982 2.8% 128 0.3% HealthCura (ACE) Access Community Health Network 20,908 20,380 32,365 2.3% 11,985 58.8% Better Health Network (ACE) St Bernard's, Loretto, South Shore, Roseland/Aunt Martha's, Beloved 11,860 21,292 29,632 2.1% 8,340 39.2% l h l ( C ) l h 2 926 23 0 2 6 0 2 0% 3 9 3 6 6% UI Health Plus (ACE) UI Health 12,926 23,707 27,650 2.0% 3,943 16.6% Loyola Family Care (ACE) Loyola Univ Health System 22,060 23,780 23,501 1.7% (279) ‐1.2% Next Level (CCE serving ACA only) 2,174 9,222 9,177 0.7% (45) ‐0.5% Illinois Partnership for Health (ACE) Blessing Health System, Cadence, Decatur Memorial, KishHealth, Memorial Health, OSF, Riverside Medical Ctr, Rockford Health System, Carle Fdn 3,676 3,610 3,674 0.3% 64 1.8% L i Child ' H l h P UI Health Plus (ACE) UI Health 12,926 23,707 27,650 2.0% 3,943 16.6% Loyola Family Care (ACE) Loyola Univ Health System 22,060 23,780 23,501 1.7% (279) ‐1.2% Next Level (CCE serving ACA only) 2,174 9,222 9,177 0.7% (45) ‐0.5% Illinois Partnership for Health (ACE) Blessing Health System, Cadence, Decatur Memorial, KishHealth, Memorial Health, OSF, Riverside Medical Ctr, Rockford Health System, Carle Fdn 3,676 3,610 3,674 0.3% 64 1.8% L i Child ' H l h P
www.countycare.com | 312.864.8200 | Sponsored by the Cook County Health & Hospitals System.
5
Lurie Children's Health Partners (CSN CCE) Lurie Childrens Hospital 1,596 1,688 1,678 0.1% (10) ‐0.6% LaRabida Coordinated Care Network (CSN CCE) La Rabida Childrens Hospital 595 637 541 0.0% (96) ‐15.1% Total 1,117,212 1,269,601 1,393,646 124,045 9.8% Lurie Children's Health Partners (CSN CCE) Lurie Childrens Hospital 1,596 1,688 1,678 0.1% (10) ‐0.6% LaRabida Coordinated Care Network (CSN CCE) La Rabida Childrens Hospital 595 637 541 0.0% (96) ‐15.1% Total 1,117,212 1,269,601 1,393,646 124,045 9.8%
Source: IL HFS, Chicago Region (includes suburban Cook & Collar g g ( Counties)
ICP Greater Chicago Region (SPD population)
F b'15 M '15 % Change ' Feb'15 Mar'15 # # # % Total Aetna Better Health Inc. 29,130 28,852 28,640 30.1% (212) ‐0.7% IlliniCare Health Plan Inc. Centene Inc. 27,785 27,372 27,178 28.5% (194) ‐0.7% Community Care Alliance of Illinois Family Health Network 7,793 7,841 7,740 8.1% (101) ‐1.3% Blue Cross/Blue Shield of Illinois Health Care Services Corp 5,998 6,201 6,288 6.6% 87 1.4% # Change Month Prior Month Prior Health Plan Sponsoring Organization(s) Apr'15 Humana Health Plan 4,542 4,588 4,524 4.7% (64) ‐1.4% Meridian Health Plan 4,332 4,447 4,457 4.7% 10 0.2% Cigna HealthSpring of Illinois 4,300 4,390 4,410 4.6% 20 0.5% Next Level (CCE) 3,516 3,423 3,353 3.5% (70) ‐2.0% CountyCare Cook County/CCHHS 2,586 2,648 2,704 2.8% 56 2.1% Healthcare Consoritum of IL (St Bernard, Chicago Family, EntireCare (CCE) St James, MFS, South Shore, Roseland, HRDI, Metro South) 2,584 2,548 2,468 2.6% (80) ‐3.1% Together4Health (CCE) Heartland Health Outreach 2,309 2,273 2,175 2.3% (98) ‐4.3% Be Well (CCE) MADO Healthcare 1,380 1,384 1,368 1.4% (16) ‐1.2% Total 96,255 95,967 95,305 (662) ‐0.7%
www.countycare.com | 312.864.8200 | Sponsored by the Cook County Health & Hospitals System.
6
www.countycare.com | 312.864.8200 | Sponsored by the Cook County Health & Hospitals System.
7
Change From Prior FYTD'15 Budget or % to Budget/ Change From Prior FYTD'15 Budget or % to Budget/ Key Measures Feb'15 Mar'15 Apr'15 Month Trend g Goal g Goal % 19‐24 y/o 16.3% 16.2% 15.9% ‐0.3% ‐‐ 17.0% ‐1.1% % 25‐34 y/o 16.0% 16.0% 16.1% 0.1% ‐‐ 14.8% 1.3% % 35‐44 y/o 13.4% 13.4% 13.3% ‐0.2% ‐‐ 13.5% ‐0.2% ACA Adult Membership 3/2014 Baseline Key Measures Feb'15 Mar'15 Apr'15 Month Trend g Goal g Goal % 19‐24 y/o 16.3% 16.2% 15.9% ‐0.3% ‐‐ 17.0% ‐1.1% % 25‐34 y/o 16.0% 16.0% 16.1% 0.1% ‐‐ 14.8% 1.3% % 35‐44 y/o 13.4% 13.4% 13.3% ‐0.2% ‐‐ 13.5% ‐0.2% ACA Adult Membership 3/2014 Baseline % 45‐54 y/o 26.0% 25.8% 25.0% ‐0.8% ‐‐ 27.6% ‐2.6% % 55+ y/o 29.0% 28.6% 27.7% ‐0.9% ‐‐ 27.0% 0.7% Pharmacy # Scripts filled 136,708 179,367 177,742 (1,625) % Utilizing Members 31% 32% 29% ‐3.0% % 45‐54 y/o 26.0% 25.8% 25.0% ‐0.8% ‐‐ 27.6% ‐2.6% % 55+ y/o 29.0% 28.6% 27.7% ‐0.9% ‐‐ 27.0% 0.7% Pharmacy # Scripts filled 136,708 179,367 177,742 (1,625) % Utilizing Members 31% 32% 29% ‐3.0% # Scripts/Utilizer 3.44 3.60 3.40 (0.20) ‐‐ % Generic dispensing 83% 83% 83% 0% ‐‐ % Brand Single Source 16% 16% 16% 0% ‐‐ % Formulary 98% 98% 98% 0% ‐‐ 98% 0.0% % CCHHS HIV pt meds @ CCHHS pharmacy 29.8% 33.1% 36.7% 3.6% 80% ‐43.3% % M i t R E t d d S l ( 84 d ) 13 1% 15 1% 30 0% 14 9% 85% 55 0% # Scripts/Utilizer 3.44 3.60 3.40 (0.20) ‐‐ % Generic dispensing 83% 83% 83% 0% ‐‐ % Brand Single Source 16% 16% 16% 0% ‐‐ % Formulary 98% 98% 98% 0% ‐‐ 98% 0.0% % CCHHS HIV pt meds @ CCHHS pharmacy 29.8% 33.1% 36.7% 3.6% 80% ‐43.3% % M i t R E t d d S l ( 84 d ) 13 1% 15 1% 30 0% 14 9% 85% 55 0% % Maintenance Rx on Extended Supply (>84 days) 13.1% 15.1% 30.0% 14.9% 85% ‐55.0% Reinsurance # Claims filed 0.0% % Maintenance Rx on Extended Supply (>84 days) 13.1% 15.1% 30.0% 14.9% 85% ‐55.0% Reinsurance # Claims filed 0.0%
www.countycare.com | 312.864.8200 | Sponsored by the Cook County Health & Hospitals System.
8
Key Measures Feb'15 Mar'15 Apr'15 May'15 Change From Prior Month Trend FYTD'15 Budget or Goal % to Budget/ Goal PCMH Assignment % Members Assigned to PCMH 99.9% 98.5% 96.7% 96.3% ‐0.4% % Members Unassigned 0.1% 1.5% 3.3% 3.7% 0.4% ‐‐ # Assigned CCHHS/ACHN 29,810 33,986 36,268 36,559 291 % Total Members @ CCHHS/ACHN 23.3% 22.2% 20.2% 19.9% ‐0.3% ‐‐ # Assigned MHN ACO 48,148 59,852 79,542 82,416 2,874 % Total Members @ MHN ACO 37.7% 39.1% 44.3% 44.9% 0.6% ‐‐ Member Risk Stratification Total Outreached Members YTD 54,894 73,402 75,684 2,282 Health Risk Assessments/Screenings YTD 19,242 26,829 32,571 5,742 YTD % High Risk Members 3.1% 2.5% 2.4% ‐0.1% ‐‐ 2.0% 0.4% Referral Management # Authorizations: Inpatient 1,355 1,677 2,132 455 # Authorizations: Outpatient 2,092 2,901 3,397 496 ACA Utilization Management (rolling 12 month) Admits/1,000 member months 169 175 167 (8) 168 ‐0.6% Bed Days/1,000 member months 754 781 740 (41) 737 0.4% ALOS 4.9 4.5 4.4 (0.1) ‐‐ 4.4 0.0% Nov'14 Baseline ED Visits/1,000 member months 1,003 989 967 (22) 1,017 ‐4.9% % 30‐day Readmissions 22% 23% 21% ‐2% 20% 5.0% ACA CCHHS Utilization (since 7/1/2014) FY'15 Q1* (N=242,564) FYTD'15 Q2* (N=143,170) Emergency Room 14.2% 14.3% 0.0% ‐‐ 17.2% ‐2.9% Hospital Inpatient 12.4% 14.1% 1.7% 10.9% 3.2% FY'14 Q4 Benchmark
www.countycare.com | 312.864.8200 | Sponsored by the Cook County Health & Hospitals System.
9
Hospital Outpatient 31.2% 44.7% 13.5% 28.8% 15.9% Other Medical 0.6% 0.8% 0.1% ‐‐ 1.1% ‐0.3% Primary Care 37.7% 32.6% ‐5.1% 39.8% ‐7.2% Specialist 12.1% 9.2% ‐2.8% 6.8% 2.4% Total 18.8% 17.9% ‐0.9% ‐‐ 19.1% ‐1.2%
Key Measures Feb'15 Mar'15 Apr'15 Change From Prior Month Trend FYTD'15 Budget or Goal % to Budget/ Goal Call Center Goal Goal Met Call Volume 25,825 29,950 29,374 (576) Key Measures Feb'15 Mar'15 Apr'15 Change From Prior Month Trend FYTD'15 Budget or Goal % to Budget/ Goal Call Center Goal Goal Met Call Volume 25,825 29,950 29,374 (576) Abandonment rate 2.6% 1.4% 1.4% 0.1% <4% Y Hold time :00:38 :00:23 :00:27 < :01:00 Y Average speed to answer :00:23 :00:13 :00:14 < :00:45 Y Claims Processing # Days Goal Met # Claims Paid 64,463 93,786 66,926 (26,860) Abandonment rate 2.6% 1.4% 1.4% 0.1% <4% Y Hold time :00:38 :00:23 :00:27 < :01:00 Y Average speed to answer :00:23 :00:13 :00:14 < :00:45 Y Claims Processing # Days Goal Met # Claims Paid 64,463 93,786 66,926 (26,860) # Claims Recv'd 77,544 120,558 157,432 36,874 FY'15 Q1 FYTD'15 Q2 Avg # Days Received‐to‐Processed 4 4 < 8 Y Avg # Days Received‐to‐Paid/Pend 27 22 < 35 Y * Data incomplete pending claims run‐out. # Claims Recv'd 77,544 120,558 157,432 36,874 FY'15 Q1 FYTD'15 Q2 Avg # Days Received‐to‐Processed 4 4 < 8 Y Avg # Days Received‐to‐Paid/Pend 27 22 < 35 Y * Data incomplete pending claims run‐out.
www.countycare.com | 312.864.8200 | Sponsored by the Cook County Health & Hospitals System.
10
Four‐pronged approach required by MCCN contract
3 Stakeholder Advisory Committee (Quarterly)
www.countycare.com | 312.864.8200 | Sponsored by the Cook County Health & Hospitals System.
11
Topic EAC Participants General Feedback Health Plan US Mail preferred Health Plan Communication US Mail preferred Ok with calls to receive reminders & updates Services Need trainings on how to better access services and resources resources. Information on Specific Services Should highlight and promote dental, transportation & vision Few understood how to access transportation services Few understood how to access transportation services Plan Choice Do not fully comprehend the choices that they will have to make to stay with CountyCare or switch plans. Did not understand that they would need to select y their plan each year and that this process is separate from the redetermination. R d t i ti General awareness of need to provide information
www.countycare.com | 312.864.8200 | Sponsored by the Cook County Health & Hospitals System.
Redetermination p
12
Question N % Yes % No
In the last 6 months, have you made any appointments for a check‐up or 99 88% 12% routine care at a doctor’s office or clinic? 99 88% 12% A personal doctor is the one you would see if you need a check‐up, want advice about a health problem, or get sick or hurt. Do you have a personal doctor? 94 72% 28% Did your personal doctor explain things in a way that was easy to Did your personal doctor explain things in a way that was easy to understand? 87 72% 28% In the past 6 months, have you called our member services phone number (312‐864‐8200)? 96 56% 44% Did you feel that after calling member services & speaking to a 76 72% 28% y g p g representative, you had the information or help that you needed? 76 72% 28% Since joining the CountyCare Health Plan, do you feel better (more healthy)? 97 89% 11% Have you used the CountyCare website (www.CountyCare.com) to find 99 22% 78% information about your coverage? 99 22% 78% Are you worried about a place to stay tonight or in the near future? 98 44% 56% Are you worried that the food for you &/or your family will run out before there is money to buy more? 95 32% 68% W ld d C t C H lth Pl t f i d f il
www.countycare.com | 312.864.8200 | Sponsored by the Cook County Health & Hospitals System.
13
Would you recommend CountyCare Health Plan to a friend or family member? 96 96% 4%
GOAL: Reduce vacancies to 600
2 CCHHS Board Meeting I 05/29/15
FY15 Hires: Comparison of FY13, FY14 to FY15 (thru 04/20/15)
FY15 Vacancies Filled by Job Function / Open Positions (YTD vacancies filled has increased by 106% as compared to this same time frame last year)
Job Function
FY14
Hired
FY14
YTD Thru April 2014
FY15
YTD Thru April 2015
FY15
RTHs in Process (As of 4/20/15) Finance
15 1 17
1 126
HIS
5 2 4 18
Licensed Practice Nurses
24 2 11 7
Nursing (CNI, CNII, APN, Nurse Coordinator, Clinician)
311 70 146 313
Physicians
97 38 28 94
Pharmacy
49 20 8 47
Other
373 83 234 239 Total 874 216 448
2 844
Dec Jan Feb Mar Apr May Jun Jul Aug Sep Oct Nov FY13 (717) 34 26 92 51 66 86 58 83 36 41 77 67 FY14 (874) ^22% 49 37 33 38 60 53 113 82 86 70 104 149 FY15 (448) 69 101 85 73 120 50 100 150 200
# of Hires
VACANCIES FILLED
1 Medicaid eligibility insourcing 2 Fluctuates month to month based on vacancies filled hires and new requisitions received.
Thru 04/20/15
FY13 717 FY14 874 Increase by 22% FY15 448-Thru 04/20/15
FY15 HR Goal: Improve/Reduce Average Time to Hire
3 CCHHS Board Meeting I 05/29/15
FY15 Goals:
2014 Actual 2015 Target Dec Actual Jan Actual Feb Actual Mar Actual Apr Actual May Actual June Actual YTD Avg YTD Variance a Average # of days from Request to Hire approval to Posting Open
91 30 80 48 73 51 19 50 67%
b Average # of posting days
14 14 13 9 12 13 13 12
c Average # of days from Posting Close to Interview Referral
28 25 33 22 27 30 33 29 16%
d Average # of days from Interview Referral to Decision to Hire to HR. (Interview/Selection)
29 40 29 23 32 28 40 31
e Average # of days from decision to hire until actual Hire Date. Credentialed Positions: Physicians, Psychologist, Physician Assistant I and Advanced Practice Nurses.
41 30 55 49 51 52 46 50 53%
f Average # of days from Request to Hire to Hire Date
203 139 209 151 195 168 151 172 24%
RTH in HR to Posting Job Description & Minimum Qualification Questions Finalized and Approved by Hiring Dept. & HR Posting Start Posting End Candidate List sent to department
“d”- Interview Selection
Decision to hire from department to HR Hire date HR Hiring Dept Shared
30 Days 14 Days 25 Days 40 Days 30 Days 139 Days (total)
Benchmark: 58 Data source: TLNT The Business of HR
http://www.tlnt.com/2014/08/14/employers-find-that-time-to-fill-job-rates-are-growing-hit-13-year-high/
“a”- Draft Posting “b”- Posting Period “c”- Validation “e”- External Offer / Onboard
Budget to Recruiting average of 30 Days
Goal: Within 10% of target
4 CCHHS Board Meeting I 05/29/15
9
1292 32 63 196 40 88 168 59 85 113 448 200 400 600 800 1,000 1,200 1,400
Count of positions Hiring Waterfall & Snapshot (04/30/15)
Shared Responsibility Human Resources Management Human Resources Management Human Resources
FY15 HR Goal: Improve/Reduce Average Time to Hire
1 ¡
CountyCare Income Statement March-2015 YTD YTD YTD YTD Revenue December-2014 January-2015 February-2015 March-2015 PMPM $ 52,493,344 $ 106,160,435 $ 158,557,089 $ 263,227,835 Admin
1,077,180 State Workers 88,481 206,697 470,044 632,491 Reserve for Settlement
Assessment Tax from Cash Advance
Total Revenue $ 52,581,825 $ 106,377,132 $ 159,037,133 $ 264,947,506 Application Processing Costs Hoyne Facility Expenses $ 27,684 $ 49,461 $ 67,688 $ 85,813 AHS Application Assistance Fees 1,686,709 2,674,989 3,663,268 4,651,547 CEA Application Assistance Fees 64,292 118,361 172,431 205,490 State Workers Cost 176,963 413,395 940,089 1,264,983 Total Application Processing Costs $ 1,955,648 $ 3,256,205 $ 4,843,476 $ 6,207,834 Administrative Expenses Salaries & Benefits $ 276,206 $ 307,529 $ 516,925 $ 720,687 Stop Loss Insurance 331,500 663,000 530,541 398,082 Self Insurance 36,240 72,479 96,864 129,152 Pharmacy 368,742 1,056,570 1,605,704 2,206,472 AHS TPA Fees 1,037,909 1,037,909 1,037,909 1,037,909 IlliniCare TPA Fees 4,609,010 9,310,117 14,088,708 22,046,976 Dental Admin Fees 327,084 MHN Fees 352,265 704,530 1,247,591 1,784,209 Other 41,587 93,554 120,552 453,267 Total Administrative Expenses $ 7,053,459 $ 13,245,688 $ 19,244,794 $ 29,103,839 Clinical Expenses Domestic Claims $ 17,599,212 $ 34,517,339 $ 52,840,141 $ 56,152,270 Foreign Claims 15,318,589 32,923,542 43,700,515 59,998,763 Foreign Claims IBNR 4,516,819 294,421 294,421 51,494,543 Pharmacy 5,255,670 17,254,058 27,201,257 38,052,254 Domestic Pharmacy 668,490 1,891,848 2,906,927 4,431,672 MHN ASO 828,251 1,656,502 3,218,927 4,729,338 Behavioral Health 1,353,516 2,736,774 4,236,848 6,044,431 Optical 313,413 633,714 959,392 1,305,241 Transportation
764,435 1,137,907 Dental 65,716 131,432 197,148 397,241 Total Clinical Expenses $ 45,919,677 $ 92,039,630 $ 136,320,010 $ 223,743,660 Medical Loss Ratio (MLR) 87.5% 86.7% 86.0% 85.0% Total Expenses $ 54,928,783 $ 108,541,524 $ 160,408,280 $ 259,055,333 CountyCare Net Income $ (2,346,958) $ (2,164,391) $ (1,371,148) $ 5,892,173
2 ¡
CCHHS Totals 2015 Actual 2015 Budget 2015 Budget Variance 2014 Actual REVENUE: Net Patient Service Revenue 457,622 438,347 19,275 352,604 Other Revenue 1,429 2,669 (1,239) 2,403 TOTAL REVENUE 459,051 441,015 18,036 355,007 OPERATING EXPENSES: Salaries and Benefits 222,361 222,717 356 202,411 Supplies 76,218 67,671 (8,547) 58,196 Purchased Svs, Rental & Other 215,577 224,422 8,845 123,083 Insurance Expense 6,339 7,924 1,584 8,232 Depreciation 10,189 10,189 11,193 Utilities 2,399 5,183 2,783 2,138 TOTAL OPERATING EXPENSES 533,083 538,105 5,022 405,253 GAIN (LOSS) FROM OPERATIONS (74,032) (97,090) 23,057 (50,246) NONOPERATING REVENUE 74,030 74,030 60,438 NET INCOME (LOSS) (2) (23,059) 23,057 10,192
3 ¡
All Providers CountyCare All Provider & CountyCare Eliminations 2015 Actual 2015 Budget 2015 Budget Variance 2014 Actual 2015 Actual 2015 Budget 2015 Budget Variance 2014 Actual 2015 Actual 2015 Budget 2015 Budget Variance 2014 Actual REVENUE: Net Patient Service Revenue 253,268 266,750 (13,482) 143,844 264,938 289,235 (24,297) 208,761 (60,584) (117,639) 57,055 Other Revenue 1,005 2,006 (1,001) 1,940 10 10 TOTAL REVENUE 254,273 268,756 (14,483) 145,784 264,948 289,235 (24,287) 208,761 (60,584) (117,639) 57,055 OPERATING EXPENSES: Salaries and Benefits 198,623 200,496 1,874 177,574 721 709 (12) 3,760 Supplies 35,448 42,559 7,110 30,315 44,690 22,149 (22,541) 27,807 (4,432) 4,432 Purchased Svs, Rental & Other 57,904 56,897 (1,007) 39,046 213,117 283,769 70,652 83,382 (56,152) (117,639) (61,486) Insurance Expense 5,190 7,924 2,733 7,258 527 (527) 77 Depreciation 10,103 10,103 11,106 Utilities 2,379 5,131 2,752 2,127 19 19 TOTAL OPERATING EXPENSES 309,647 323,109 13,462 267,427 259,055 306,645 47,590 115,025 (60,584) (117,639) (57,055) GAIN (LOSS) FROM OPERATIONS (55,374) (54,353) (1,021) (121,643) 5,892 (17,410) 23,303 93,735 NONOPERATING REVENUE 48,971 48,971 50,869 59 59 276 NET INCOME (LOSS) (6,404) (5,383) (1,021) (70,774) 5,951 (17,352) 23,303 94,011 4 ¡
Detainees Dept of Public Health 2015 Actual 2015 Budget 2015 Budget Variance 2014 Actual 2015 Actual 2015 Budget 2015 Budget Variance 2014 Actual REVENUE: Net Patient Service Revenue Other Revenue 1 414 663 (249) 462 TOTAL REVENUE 1 414 663 (249) 462 OPERATING EXPENSES: Salaries and Benefits 19,187 17,768 (1,419) 16,468 3,831 3,745 (86) 4,609 Supplies 392 2,917 2,526 58 119 46 (74) 16 Purchased Svs, Rental & Other 428 953 525 333 280 442 162 323 Insurance Expense 498 (498) 716 124 (124) 181 Depreciation 80 80 80 5 5 7 Utilities 2 2 2 20 31 10 9 TOTAL OPERATING EXPENSES 20,584 21,720 1,135 17,657 4,381 4,269 (111) 5,144 GAIN (LOSS) FROM OPERATIONS (20,584) (21,720) 1,136 (17,656) (3,966) (3,606) (360) (4,682) NONOPERATING REVENUE 23,739 23,739 5,208 1,262 1,262 4,085 NET INCOME (LOSS) 3,154 2,019 1,136 (12,448) (2,704) (2,344) (360) (597)
5 ¡
CCHHS: ¡Financial ¡Summary ¡
¡ * ¡Data ¡above ¡does ¡not ¡include ¡ CountyCare ¡informa0on ¡
2013 ¡ 2014 ¡ 2015# ¡ Moody's ¡Investment ¡Service ¡ Composite ¡Standard ¡/ ¡Goal ¡ Days ¡in ¡Pa0ent ¡Accounts ¡Receivable ¡(Gross)* ¡ ¡ ¡ ¡ ¡ ¡ ¡ ¡ ¡ ¡ ¡ ¡ ¡ ¡ ¡ ¡ ¡ ¡ ¡ ¡ ¡ ¡ ¡ 147 ¡ ¡ ¡ ¡ ¡ ¡ ¡ ¡ ¡ ¡ ¡ ¡ ¡ ¡ ¡ ¡ ¡ ¡ ¡ ¡ ¡ ¡ ¡ ¡ ¡ ¡ ¡ ¡ ¡ ¡ ¡ ¡ ¡ ¡ ¡ 168 ¡ ¡ ¡ ¡ ¡ ¡ ¡ ¡ ¡ ¡ ¡ 139 ¡ ¡ ¡-‑-‑-‑ ¡ Days ¡in ¡Pa0ent ¡Accounts ¡Receivable ¡(Net)* ¡ ¡ ¡ ¡ ¡ ¡ ¡ ¡ ¡ ¡ ¡ ¡ ¡ ¡ ¡ ¡ ¡ ¡ ¡ ¡ ¡ ¡ ¡ ¡ ¡ ¡ ¡ ¡48 ¡ ¡ ¡37 ¡ ¡ ¡ ¡ ¡ ¡ ¡ ¡ ¡ ¡ ¡ ¡ ¡ ¡ ¡ ¡ ¡ ¡ ¡ ¡ ¡ ¡ ¡ ¡ ¡ ¡ ¡ ¡ ¡39 ¡ ¡ ¡ ¡ ¡ ¡ ¡ ¡ ¡ ¡ ¡ ¡ ¡ ¡ ¡ ¡ ¡ ¡ ¡ ¡ ¡ ¡ ¡ ¡ ¡ ¡ ¡ ¡ ¡ ¡ ¡ ¡ ¡ ¡ ¡ ¡ ¡ ¡ ¡ ¡ ¡ ¡ ¡ ¡ ¡ ¡ ¡ ¡ ¡ ¡ ¡ ¡49.8 ¡ ¡ Days ¡Cash ¡on ¡Hand ¡ ¡ ¡ ¡ ¡ ¡ ¡ ¡ ¡ ¡ ¡ ¡ ¡ ¡ ¡ ¡ ¡ ¡ ¡ ¡ ¡ ¡ ¡ ¡ ¡ ¡ ¡ ¡50 ¡ ¡ ¡ ¡ ¡ ¡ ¡ ¡ ¡ ¡ ¡ ¡ ¡ ¡ ¡ ¡ ¡ ¡ ¡ ¡ ¡ ¡ ¡ ¡ ¡ ¡ ¡ ¡ ¡ ¡ ¡ ¡ ¡ ¡ ¡ ¡ ¡ ¡ ¡ ¡ ¡ 96 ¡ ¡ ¡ ¡ ¡ ¡ ¡ ¡ ¡ ¡ ¡ ¡ ¡ ¡ ¡ ¡ ¡ ¡ ¡ ¡ ¡ ¡ ¡ ¡ ¡ ¡ ¡ ¡ ¡68 ¡ ¡ ¡ ¡ ¡ ¡ ¡ ¡ ¡ ¡ ¡ ¡ ¡ ¡ ¡ ¡ ¡ ¡ ¡ ¡ ¡ ¡ ¡ ¡ ¡ ¡ ¡ ¡ ¡ ¡ ¡ ¡ ¡ ¡ ¡ ¡ ¡ ¡ ¡ ¡ ¡ ¡ ¡ ¡ ¡ ¡ ¡ ¡ ¡ ¡197.6 ¡ ¡ Days ¡Expense ¡in ¡Accounts ¡and ¡Claims ¡Payable ¡ ¡ ¡ ¡ ¡ ¡ ¡ ¡ ¡ ¡ ¡ ¡ ¡ ¡ ¡ ¡ ¡ ¡ ¡ ¡ ¡ ¡ ¡ ¡ ¡ ¡ ¡ ¡36 ¡ ¡ ¡ ¡ ¡ ¡ ¡ ¡ ¡ ¡ ¡ ¡ ¡ ¡ ¡ ¡ ¡ ¡ ¡ ¡ ¡ ¡ ¡ ¡ ¡ ¡ ¡ ¡ ¡ ¡ ¡ ¡ ¡ ¡ ¡ ¡ ¡ ¡ ¡ ¡ ¡ 42 ¡ ¡ ¡ ¡ ¡ ¡ ¡ ¡ ¡ ¡ ¡ ¡ ¡ ¡ ¡ ¡ ¡ ¡ ¡ ¡ ¡ ¡ ¡ ¡ ¡ ¡ ¡ ¡ ¡53 ¡ ¡ ¡ ¡ ¡ ¡ ¡ ¡ ¡ ¡ ¡ ¡ ¡ ¡ ¡ ¡ ¡ ¡ ¡ ¡ ¡ ¡ ¡ ¡ ¡ ¡ ¡ ¡ ¡ ¡ ¡ ¡ ¡ ¡ ¡ ¡ ¡ ¡ ¡ ¡ ¡ ¡ ¡ ¡ ¡ ¡ ¡ ¡ ¡ ¡ ¡ ¡63.4 ¡ ¡ Opera0ng ¡Margin ¡as ¡% ¡of ¡Total ¡Opera0ng ¡Revenue ¡
2.0% ¡ Average ¡Age ¡of ¡Plant ¡(in ¡Years) ¡ ¡ ¡ ¡ ¡ ¡ ¡ ¡ ¡ ¡ ¡ ¡ ¡ ¡ ¡ ¡ ¡ ¡ ¡ ¡ ¡ ¡ ¡ ¡14.1 ¡ ¡ ¡ ¡ ¡ ¡ ¡ ¡ ¡ ¡ ¡ ¡ ¡ ¡ ¡ ¡ ¡ ¡ ¡ ¡ ¡ ¡ ¡ ¡ ¡ ¡ ¡ ¡ ¡ ¡ ¡ ¡ ¡ ¡ ¡ ¡ ¡ 15.9 ¡ ¡ ¡ ¡ ¡ ¡ ¡ ¡ ¡ ¡ ¡ ¡ ¡ ¡ ¡ ¡ ¡ ¡ ¡ ¡ ¡ ¡ ¡ ¡ ¡17.2 ¡ ¡ ¡ ¡ ¡ ¡ ¡ ¡ ¡ ¡ ¡ ¡ ¡ ¡ ¡ ¡ ¡ ¡ ¡ ¡ ¡ ¡ ¡ ¡ ¡ ¡ ¡ ¡ ¡ ¡ ¡ ¡ ¡ ¡ ¡ ¡ ¡ ¡ ¡ ¡ ¡ ¡ ¡ ¡ ¡ ¡ ¡ ¡ ¡ ¡ ¡ ¡10.7 ¡ ¡ Over0me ¡as ¡Percentage ¡of ¡Gross ¡Salary ¡ 8.2% ¡ 8.3% ¡ 8.8% ¡ 5.0% ¡ Average ¡Daily ¡Carelink ¡/ ¡Charity ¡Write-‑Offs ¡(at ¡cost)^ ¡ ¡ ¡ ¡ ¡ ¡ ¡ ¡ ¡ ¡ ¡ ¡ ¡ ¡ ¡ ¡ ¡581,176 ¡ ¡ ¡ ¡ ¡ ¡ ¡ ¡ ¡ ¡ ¡ ¡ ¡ ¡ ¡ ¡ ¡ ¡ ¡ ¡ ¡ ¡ ¡ ¡ ¡ ¡ ¡ ¡ ¡ ¡ 482,984 ¡ ¡ ¡ ¡ ¡ ¡ ¡ ¡ ¡ ¡ ¡ ¡ ¡ ¡ ¡ ¡ ¡ ¡177,837 ¡ ¡ ¡-‑-‑-‑ ¡ CareLink/Charity ¡Write-‑offs ¡(at ¡cost) ¡ ¡212,129,170 ¡ ¡ ¡ ¡ ¡ ¡ ¡ ¡ ¡ ¡ ¡ ¡ ¡ ¡ ¡ ¡ ¡ 176,289,026 ¡ ¡ ¡64,910,634 ¡ ¡ Average ¡Daily ¡Bad ¡Debt ¡Expense ¡(at ¡cost) ¡ ¡ ¡ ¡ ¡ ¡ ¡ ¡ ¡ ¡ ¡ ¡ ¡ ¡ ¡ ¡ ¡848,471 ¡ ¡ ¡ ¡ ¡ ¡ ¡ ¡ ¡ ¡ ¡ ¡ ¡ ¡ ¡ ¡ ¡ ¡ ¡ ¡ ¡ ¡ ¡ ¡ ¡ ¡ ¡ ¡ ¡ ¡ 461,445 ¡ ¡ ¡ ¡ ¡ ¡ ¡ ¡ ¡ ¡ ¡ ¡ ¡ ¡ ¡ ¡ ¡ ¡185,957 ¡ ¡ ¡-‑-‑-‑ ¡ Bad ¡debt ¡Expense ¡(at ¡cost) ¡ ¡ ¡ ¡ ¡309,691,828 ¡ ¡ ¡ ¡ ¡ ¡ ¡ ¡ ¡ ¡ ¡ ¡ ¡ ¡ ¡ ¡ 168,427,323 ¡ ¡ ¡ ¡67,874,267 ¡ ¡
Source: ¡CCHHS ¡finance ¡ ¡
# ¡ ¡Data ¡through ¡March ¡2015 ¡ ^ ¡This ¡represents ¡direct ¡charity ¡care ¡write-‑offs ¡ ¡to ¡ ¡gross ¡accounts ¡receivable ¡
6 ¡
CCHHS: ¡Monthly ¡-‑Inpa0ent ¡Days, ¡Emergency ¡Visits ¡and ¡Outpa0ent ¡Clinic ¡Registra0ons ¡
Source: ¡CERNER ¡
FY ¡2013 ¡ (Monthly ¡Average) ¡ ¡ FY ¡2014 ¡ (Monthly ¡Average) ¡ ¡ FY ¡2015* ¡ (Monthly ¡Average) ¡ ¡ Monthly ¡Target ¡ Inpa0ent ¡Days ¡ 9,225 ¡ 8,752 ¡ 8,054 ¡ 8,315 ¡ ¡ ¡ ¡ ¡ ¡ ¡ ¡ ¡ Observa0on ¡Days ¡ 669 ¡ 839 ¡ 926 ¡ 797 ¡ Emergency ¡ ¡14,261 ¡ ¡ ¡12,887 ¡ ¡ 12,077 ¡ ¡ ¡ ¡ ¡12,887 ¡ ¡ Outpa0ent ¡ 80,989 ¡ ¡ 78,021 ¡ ¡ 75,403 ¡ ¡ ¡ ¡ ¡ ¡ ¡ ¡ ¡ ¡ ¡ ¡85,824 ¡ ¡
*data ¡through ¡March ¡2015 ¡
7 ¡