
Summary dashboard Summary dashboard
Speed Speed Quality Quality Cost Cost
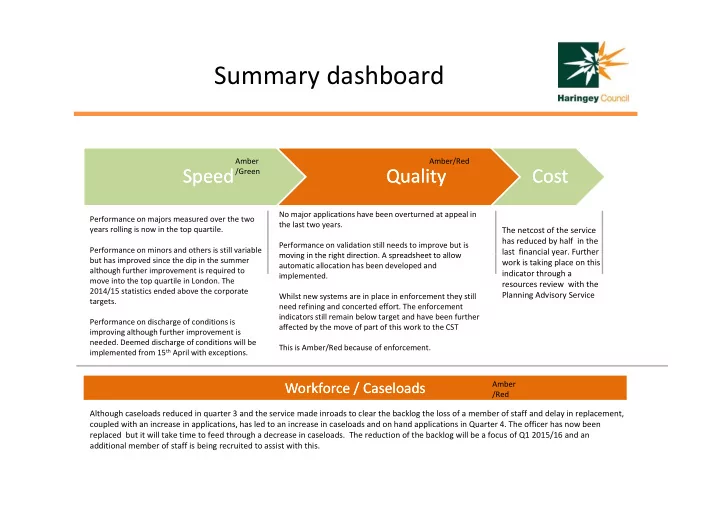
Amber/Red Amber /Green Performance on majors measured over the two years rolling is now in the top quartile. Performance on minors and others is still variable The netcost of the service has reduced by half in the last financial year. Further No major applications have been overturned at appeal in the last two years. Performance on validation still needs to improve but is moving in the right direction A spreadsheet to allow but has improved since the dip in the summer although further improvement is required to move into the top quartile in London. The 2014/15 statistics ended above the corporate targets. last financial year. Further work is taking place on this indicator through a resources review with the Planning Advisory Service moving in the right direction. A spreadsheet to allow automatic allocation has been developed and implemented. Whilst new systems are in place in enforcement they still need refining and concerted effort. The enforcement Performance on discharge of conditions is improving although further improvement is
- needed. Deemed discharge of conditions will be
implemented from 15th April with exceptions. indicators still remain below target and have been further affected by the move of part of this work to the CST This is Amber/Red because of enforcement.
Workforce / Caseloads Workforce / Caseloads
Although caseloads reduced in quarter 3 and the service made inroads to clear the backlog the loss of a member of staff and delay in replacement, coupled with an increase in applications, has led to an increase in caseloads and on hand applications in Quarter 4. The officer has now been Amber /Red p pp , pp Q replaced but it will take time to feed through a decrease in caseloads. The reduction of the backlog will be a focus of Q1 2015/16 and an additional member of staff is being recruited to assist with this.