prin pr inci ciples ples What are some key features and benefits - - PDF document

prin pr inci ciples ples
SMART_READER_LITE
LIVE PREVIEW

prin pr inci ciples ples What are some key features and benefits - - PDF document

7/18/2014 Dat Data a da dashbo shboards: ards: Pu Purpo pose, se, proc process ess, , and and What is a dashboard? prin pr inci ciples ples What are some key features and benefits of a dashboard? How to decide if a dashboard is


slide-1
SLIDE 1

7/18/2014 1

Dat Data a da dashbo shboards: ards: Pu Purpo pose, se, proc process ess, , and and pr prin inci ciples ples

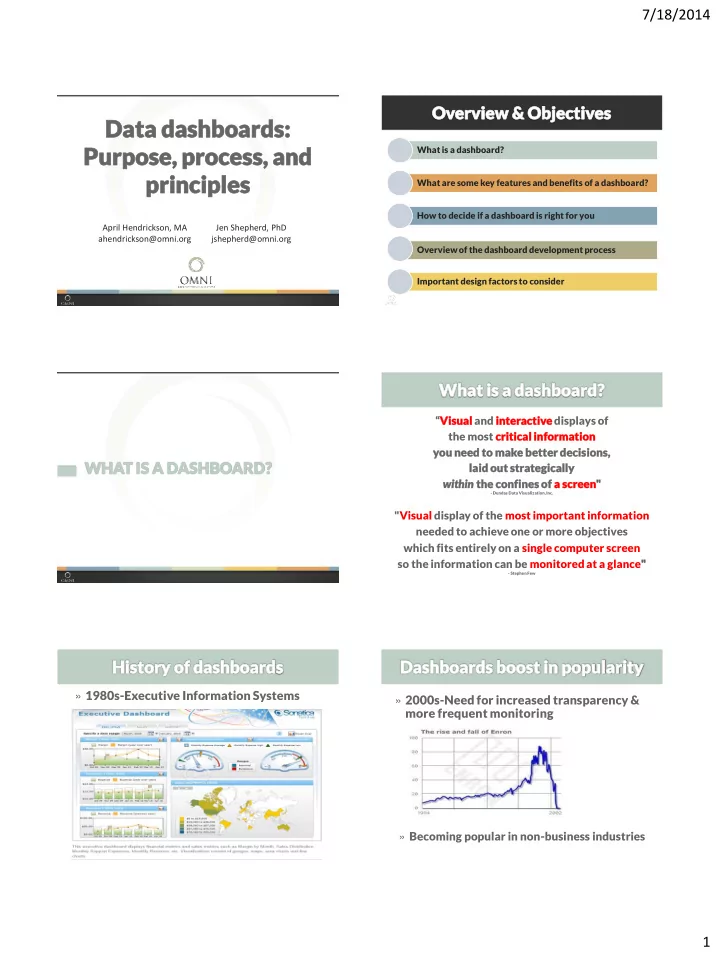
April Hendrickson, MA ahendrickson@omni.org Jen Shepherd, PhD jshepherd@omni.org What is a dashboard? What are some key features and benefits of a dashboard? How to decide if a dashboard is right for you Overview of the dashboard development process Important design factors to consider

WHA WHAT IS IS A A DAS ASHBO HBOARD? ARD?

"Performance dashboards are vi visual sual and inter eract active displays

  • f the most cr

critical cal infor format ation you need to to mak make better d r deci cisi sions, , lai aid o d out ut s strate ategical ally wit within in the c confi fines s of f a a sc scree reen" "

  • Dundas Data Visualization, Inc.

"Visual display of the most important information needed to achieve one or more objectives consolidated on a single screen (or page) so it can be monitored and understood at a glance" "

  • Stephen Few

“Vi Visual al and inter teract activedisplays of the most cr criti tical cal infor format mation you nee eed t to mak make bett e better er deci ecisions, , lai aid out t str trat ategi egical cally withi hin th the e co confi fines es of f a a scr cree een" "

  • Dundas Data Visualization, Inc.

"Visual display of the most important information needed to achieve one or more objectives which fits entirely on a single computer screen so the information can be monitored at a glance" "

  • Stephen Few

» 1980s-Executive Information Systems » 2000s-Need for increased transparency & more frequent monitoring

» Becoming popular in non-business industries

slide-2
SLIDE 2

7/18/2014 2

» Track & show stakeholders in a variety of ways:

» Services provided » Participation levels » Progress » Effectiveness/Outcomes » Revenue » Organizational/program strengths & areas

for improvement

KEY F KEY FEA EATURES/ URES/BENEF BENEFITS ITS

“Big picture” snapshot & details

Inter Interact activ ive

Combine dat data a fro from dif diffe ferent rent s source rces

Customiza ustomizable ble

slide-3
SLIDE 3

7/18/2014 3 HOW T HOW TO O DECI ECIDE IF E IF A A DAS ASHBO HBOARD ARD IS A G A GOOD OOD FIT FIT FO FOR Y R YOU OU  ongoing monitoring  dynamic data  users with different interests or goals  benefits outweigh costs

» FREE: Data-Explorer, Tableau Public » LOW COST: Excel*, Tableau Desktop, DevExpress » MORE EXPENSIVE: Tableau Server, IBM Cognos, Spotfire, Dundas, LogiAnalytics, Context!, Opticon,Jaspersoft, Pyramid Analytics, Qlikview, etc., etc., etc.

» Re Reas asona

  • nably

bly price iced s d sof

  • ftwar

ware » St Strict ict secur curit ity opt y options ions » Unlimit nlimited or d or at at le leas ast ple lent ntiful vie iful viewe wer acco account unts » Dat Data s a sys ystem com compat atibili ibility y - mus ust conn connect ct to

  • Ex

Excel cel, Acces ccess, and and SQ SQL » Reasonable learning curve & implementation » Support availability » Available visualization options

DASH SHBOARD RD DE DEVELOPM OPMENT PR PROC OCESS SS

slide-4
SLIDE 4

7/18/2014 4

Visioning Data Preparation Blueprint Build Revise/ Update Demo

Adapted from Data Dashboard as Evaluation and Research Communication Tool (Smith, 2013).

» Can you evaluate what is going on? » Is it easy to spot the areas that need attention? » Does it provide enough context? » Are the data well organized? » Does the layout make sense? » How does the dashboard support better monitoring and decision making?

» https://odash.omni.org/sbirtII/ » http://public.tableausoftware.com/views/CrisisH

  • tlineSimulationDashboardV1/Dashboard6?:em

» http://public.tableausoftware.com/profile/omni# !/vizhome/ATR3/Dashboardbed=y&:display_coun t=no » http://www.dundas.com/gallery/sample- dashboards/#call-center-dashboard

slide-5
SLIDE 5

7/18/2014 5

http://chandoo.org/wp/2008/03/13/want-to-be-an-excel-conditional-formatting-rock-star- read-this/

IMPO MPORTANT D ANT DES ESIGN N FACT CTORS ORS TO O CONSI CONSIDER ER

“Elegance in communication is

  • ften achieved through

simplicity of design”

Ste tephen Few, Inf nform rmation n Dashbo board d Design: n: Th The Effective Visua ual Communi unication n of Data 2008 *Source: Stephen Few *Source: Stephen Few

slide-6
SLIDE 6

7/18/2014 6

*Source: Dundas & Stephen Few

» Tables when details and/or precision is needed » Bar graphs for categorical data » Line graphs for trend data » Avoid pie charts, bubble charts, radar graphs, and gauges

5 10 15 20 25 30 35 40

Site 1 Site 2 Site 3 Site 4

» Stephen Few:

http://www.perceptualedge.com/

» Stephanie Evergreen:

http://stephanieevergreen.com/author/evereval/

» ExcelUser-Excel Charts, Dashboards & Visualization Tools

http://exceluser.com/excel_dashboards/index.htm

» Chandoo.org-33 Recommended Resources for Learning Dashboards

http://chandoo.org/wp/2011/03/25/resources-for-making- dashboards/

OMNI Institute 899 Logan Street, Suite 600 Denver, CO. 80203 www.OMNI.org tel: 303.839.9422 or 800.279.2070 fax: 303.839.9420

Thank you!

April Hendrickson, MA ahendrickson@omni.org Jen Shepherd, PhD jshepherd@omni.org