
SLIDE 1
Quad working point
Fred Hartjes NIKHEF
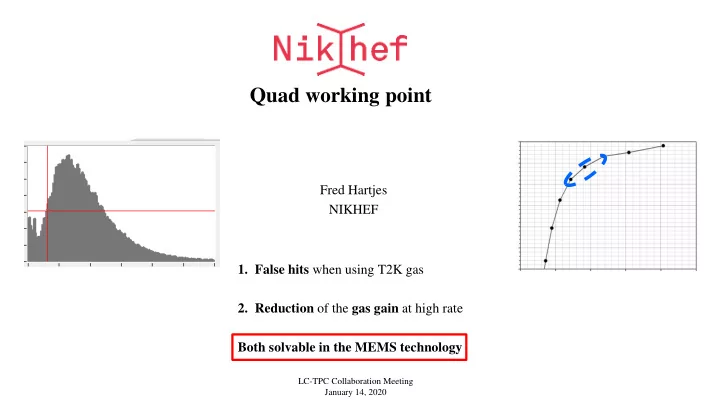
- 1. False hits when using T2K gas
- 2. Reduction of the gas gain at high rate
Both solvable in the MEMS technology
LC-TPC Collaboration Meeting January 14, 2020