
SLIDE 1
1
Q4
JOHAN DENNELIND PRESIDENT & CEO
YEAR-END REPORT JANUARY – DECEMBER 2017
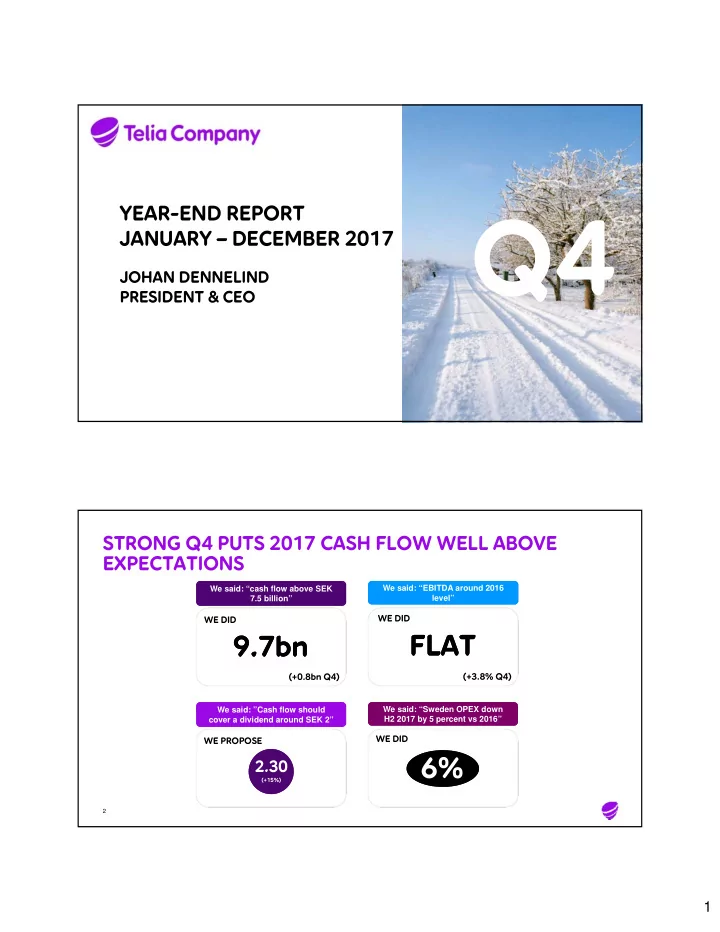
STRONG Q4 PUTS 2017 CASH FLOW WELL ABOVE EXPECTATIONS
2 We said: “cash flow above SEK 7.5 billion” We said: “cash flow above SEK 7.5 billion” We said: “Sweden OPEX down H2 2017 by 5 percent vs 2016” We said: “Sweden OPEX down H2 2017 by 5 percent vs 2016” We said: ”Cash flow should cover a dividend around SEK 2” We said: ”Cash flow should cover a dividend around SEK 2” We said: “EBITDA around 2016 level” We said: “EBITDA around 2016 level”6% 9.7bn 9.7bn
WE DID WE DID WE DID WE PROPOSE
2.30
(+15%)FLAT FLAT +3.8%
Q4+0.8bn
Q4(+3.8% Q4) (+0.8bn Q4)