
SLIDE 1
1
THE WORLD BANK
URBAN DEVELOPMENT
1
Post Disaster Needs Assessment - Housing Sector 1 1 THE WORLD BANK - - PowerPoint PPT Presentation
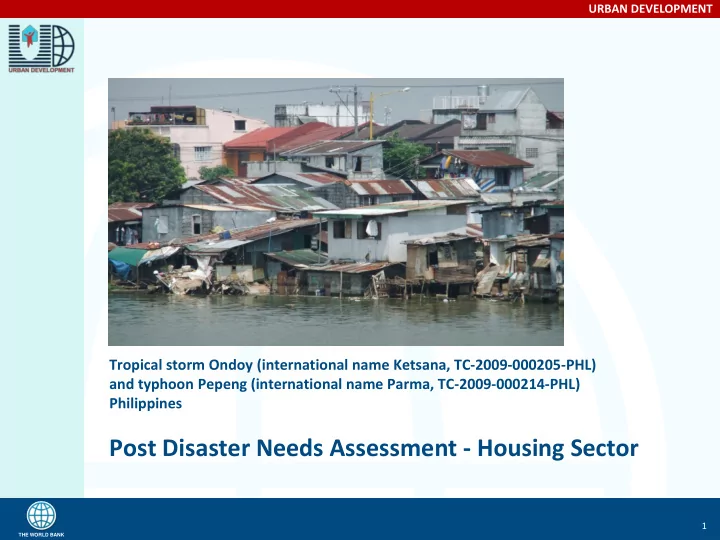
URBAN DEVELOPMENT Tropical storm Ondoy (international name Ketsana, TC-2009-000205-PHL) and typhoon Pepeng (international name Parma, TC-2009-000214-PHL) Philippines Post Disaster Needs Assessment - Housing Sector 1 1 THE WORLD BANK URBAN
1
THE WORLD BANK
URBAN DEVELOPMENT
1
2
THE WORLD BANK
URBAN DEVELOPMENT
Philippines proved to be resilient to wind and storm
material house the majority of the population in urban areas
structure are typical of small towns and urban areas and house the middle class
are found mainly in urban areas and are used by the upper middle class
urban areas and house the rich minority
3
THE WORLD BANK
URBAN DEVELOPMENT
Housing type Average size Average construction cost Average household items value sqm sqf PHP USD PHP USD Vernacular houses 20 215 20,000 420 15,000 320 Makeshift dwellings 20 215 20,000 420 15,000 320 Mixed-material houses 30 320 110,000 2,300 100,000 2,110 Strong-material houses 50 540 600,000 12,700 500,000 10,600 High end houses 200 2150 5,000,000 105,600 3,000,000 63,400
4
THE WORLD BANK
URBAN DEVELOPMENT
2% 78% 17% 3%
1% 37% 50% 10% 2%
Vernacular houses Makeshift dwellings Mixed material houses Strong material houses High end houses
Chart 1 - Housing stock totally damaged, by type Chart 2 - Housing stock partially damaged, by type
5
THE WORLD BANK
URBAN DEVELOPMENT
10% 3% 6% 1% 26% 54%
I CAR II III NCR IV-A
Region Damages Losses External sector Fiscal budget Public Private Public Private I 2,624,940,485 229,125,177 685,796,936 580,525,932 433,447,994 CAR 781,602,505 68,224,332 204,202,955 172,857,452 129,063,512 II 1,597,371,612 139,430,991 417,332,341 353,271,112 263,768,846 III 327,734,016 28,607,168 85,624,411 72,480,918 54,117,666 NCR 6,529,635,862 569,957,292 1,705,945,064 1,444,079,578 1,078,217,805 IV-A 13,574,673,270 1,184,902,830 3,546,544,915 3,002,144,202 2,241,542,213 V 5,390,362 470,513 1,408,296 1,192,120 890,093 XII 12,356,369 1,078,560 3,228,248 2,732,707 2,040,367 Total 25,453,704,480 2,221,796,862 6,650,083,166 5,629,284,020 4,203,088,496 Data in PHP
6
THE WORLD BANK
URBAN DEVELOPMENT
Relocating people from danger areas to safer ones, but close to
Addressing the needs of the informal sector and the poor; Avoiding urban sprawl, avoiding greenfield consumption, re-
Promoting in-city compact housing programs, through PPP; Leveraging natural disasters to promote urban rehabilitation and
Setting up suitable financial mechanisms to make the process
7
THE WORLD BANK
URBAN DEVELOPMENT
8
THE WORLD BANK
URBAN DEVELOPMENT
9
THE WORLD BANK
URBAN DEVELOPMENT
Informal settlements (slums): 2000 people/hectar Compact housing (mid-rise): 4000 people/hectar Low density settlements: 1000 people/hectar
10
THE WORLD BANK
URBAN DEVELOPMENT
10
Type 1 Type 2 Type 3 Type 4 Retrofitting Simple repair Total 10,468 52,979 19,049 9,524 113,952 37,984 I 1,079 12 3,247 1,623 11,751 3,917 CAR 321 964 967 483 3,499 1,166 II 657 1,971 1,976 988 7,151 2,384 III 135 404 405 203 1,467 489 NCR 2,685 16,111 4,038 2,019 29,232 9,744 IV-A 5,582 33,495 8,395 4,197 60,772 20,257 V 2 7 7 3 24 8 XII 5 15 15 8 55 18
Land Type Housing Type Unit Cost PHP NCR and IV A Other Regions Brownfield Type 1 - Finished Mid Rise 600,000 10% 10% Brownfield Type 2 - Core Mid Rise 330,000 60% 30% Greenfield Type 3 - Core Low Density 220,000 20% 40% Greenfield Type 4 - Serviced Lot 100,000 10% 20%
11
THE WORLD BANK
URBAN DEVELOPMENT
11
Recovery Reconstruction Total Region Short term Medium term Short term Medium term Short term Medium term Total 6,300,887,190 9,801,380,073 14,702,070,109 39,205,520,292 21,002,957,299 49,006,900,364 I 458,823,765 713,725,856 1,070,588,785 2,854,903,426 1,529,412,549 3,568,629,282 CAR 164,636,795 256,101,681 384,152,522 1,024,406,725 548,789,317 1,280,508,406 II 336,604,658 523,607,245 785,410,868 2,094,428,981 1,122,015,525 2,618,036,226 III 69,018,591 107,362,252 161,043,379 429,449,010 230,061,970 536,811,262 NCR 1,486,021,952 2,311,589,703 3,467,384,554 9,246,358,811 4,953,406,506 11,557,948,514 IV-A 3,128,739,202 4,866,927,647 7,300,391,470 19,467,710,588 10,429,130,672 24,334,638,235 V 1,134,995 1,765,548 2,648,322 7,062,193 3,783,317 8,827,741 XII 2,601,767 4,047,193 6,070,790 16,188,773 8,672,557 20,235,967
12
THE WORLD BANK
URBAN DEVELOPMENT
12