
SLIDE 1
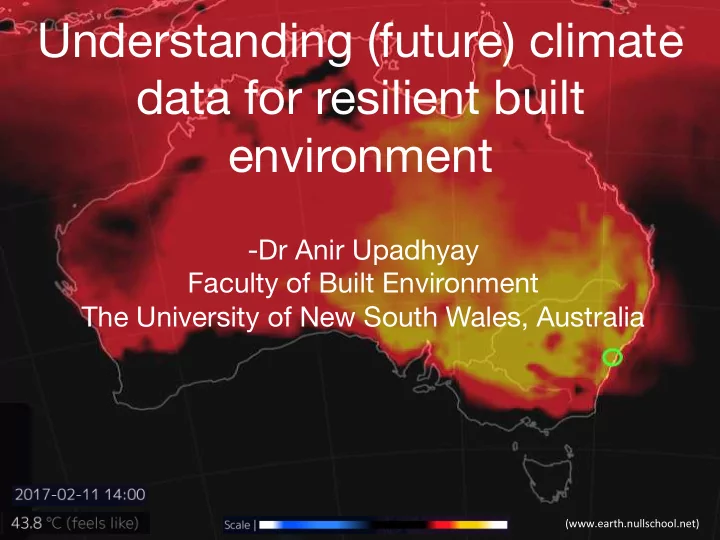
Understanding (future) climate data for resilient built environment
- Dr Anir Upadhyay
Faculty of Built Environment The University of New South Wales, Australia
(www.earth.nullschool.net) ¡
Understanding (future) climate data for resilient built environment - - PowerPoint PPT Presentation
Understanding (future) climate data for resilient built environment -Dr Anir Upadhyay Faculty of Built Environment The University of New South Wales, Australia (www.earth.nullschool.net) Bioclima(c Design Considers human
(www.earth.nullschool.net) ¡
(Olgyay, V., 1963)
(Olgyay, V., 1963)
Gaza, ¡Israel, ¡Middle ¡East ¡ ¡(hCp://eartharchitecture.org/?tag=domes) ¡ Malay ¡house, ¡Malaysia ¡(hCp://nalenda14.blogspot.com.au/2010/11/malay-‑ vernacular-‑architecture.html) ¡
Hot ¡and ¡Dry ¡climate ¡ Hot ¡and ¡Humid ¡climate ¡
Kinross ¡house, ¡Scotland, ¡UK ¡(hCps://upload.wikimedia.org/wikipedia/commons/2/22/ Kinross_House_-‑_geograph.org.uk_-‑_1210362.jpg) ¡ Upper ¡Mustang, ¡Nepal ¡(hCp://www.toptravelleads.com/thakali-‑people-‑of-‑lower-‑mustang-‑district-‑ mixed-‑tradi=ons-‑between-‑dhaulagiri-‑and-‑annapurna/) ¡
Cold ¡climate ¡ Cold ¡climate ¡
(IPCC, ¡2014: ¡Climate ¡Change ¡2014: ¡Synthesis ¡Report) ¡
Sydney ¡airport ¡(Mascot) ¡
Sydney ¡airport ¡(Mascot) ¡ ¡
¡
2030 ¡Mid ¡Emissions ¡Warmest ¡Likely ¡(model ¡A1B) ¡(CSIRO-‑MK3.5) ¡
2030 ¡ TMY ¡ Sydney ¡airport ¡(Mascot) ¡
Sydney ¡airport ¡(Mascot) ¡
Average ¡monthly ¡temperature ¡= ¡24.60C ¡ Average ¡monthly ¡temperature ¡= ¡23.00C ¡