
SLIDE 1
Pine L a ke Red Lake Watershed District Pro je c t Histo ry In - - PowerPoint PPT Presentation
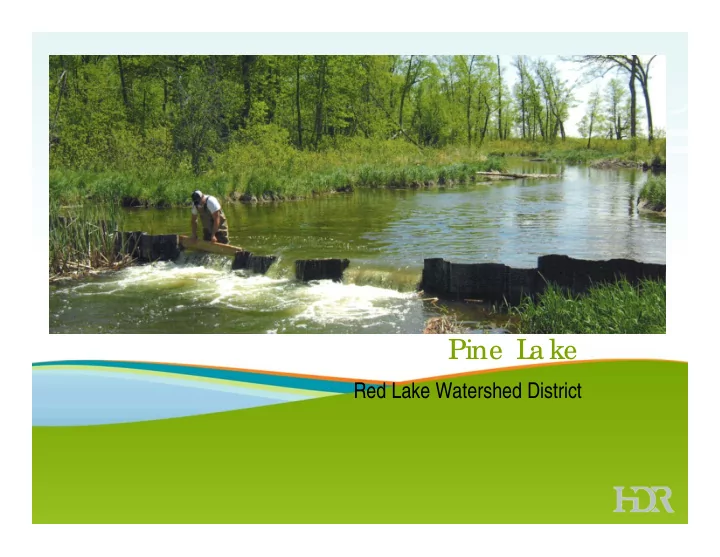
Pine L a ke Red Lake Watershed District Pro je c t Histo ry In 1980, the Clearwater County Board of Commissioners petitioned the Red Lake Watershed District for an improvement of the Pine Lake outlet that would provide the public with
Historic, measured WSE Modeled using RRBC 1997 Snowmelt scenario
Potential Flood Impact
elevation of 52 cabins
elevations of 22 cabins
Lake outlet
Sportsman Dr Highway 7
by removing the 1284.5 feet weir portion and raising the 1283.5 feet weir portions
Existing lake outlet Conceptual lake outlet 1286.0’ 1284.5’ 1284.0’ 1283.5’ 1281.5’ 1286.0’ 1284.0’ 1281.5’ 1283.5’
WAT ER BUDG ET : T YPIC AL SUMMER (WEIR C REST AT 1284.00)
PHOTOS COURTESY OF RED LAKE WATERSHED DISTRICT
RET ENT IO N SIT E RANKING MAT IRX
favorable and a ranking of 7 is less favorable with respect to a particular criterion.
applied to that criterion.
feasible site based upon this relative scale approach.
x 1 x 1 x 1.5 x 1 x 1.5 x 1.5 x 1 x 1 x 1 x 1
Site Drainage Area Sq. Miles Miles
Stream RA N K Miles
Roads RA N K Volume of Embankment (CY) RA N K Maximum Embankment Height (ft) RA N K Acres of Wetlands Impacted RA N K AC‐FT Storage RA N K Inches of Runoff Captured RA N K Homes / Barns RA N K Number of Landowners affected RA N K Flooded Footprint acres RA N K SUM RA N K A 24.1 5.4 5 2.0 7 235400 4 17.0 2 194 3 4075 4 3.2 7 6 7 13 6 482 4 50.0 7 B 23.8 5.2 4 1.5 6 343500 5 21.8 3 209 5 4900 3 3.9 5 1 11 4 500 5 43.0 4 C 21.4 6.5 6 1.5 5 674700 7 32.5 5 206 4 7000 2 6.1 2 2 5 11 4 530 6 47.5 5 C‐1 21.2 7.6 7 0.6 4 570800 6 35.1 7 326 6 7001 1 6.2 1 1 16 7 594 7 48.0 6 D 18.5 5.0 3 0.1 3 212700 3 32.1 4 93 2 3220 5 3.3 6 1 8 1 265 2 31.5 2 E 9.6 3.1 2 0.0 1 54600 2 34.6 6 74 1 3032 6 5.9 4 2 5 8 1 204 1 30.0 1 F 6.0 1.6 1 0.0 1 2600 1 9.5 1 359 7 1901 7 5.9 3 1 8 1 447 3 32.5 3 Rating Multiplier
Peak Discharge (CFS) Existing 787 Site D 591 Site E 649 Site F 696
SITE D NO IMPOUNDMENTS SITE F SITE E
ADD SCREENSHOT FROM ARCSCENE ADD SCREENSHOT FROM ARCSCENE
plant beds
See Pine Lake Water Quality Analysis by RMB Environmental Laboratories, 2011
PHOTO COURTESY OF RED LAKE WATERSHED DISTRICT
C O NVENT IO NAL PO L L UT ANT S
EUT RO PHIC AT IO N ST ANDARDS
ST ANDARDS
Organisms per 100 mL
1 2 3 4 5 6 7 8 9 10 11 12 13 14 15 DO (mg/L) Date
Lost River and Pine Lake ‐ Dissolved Oxygen
Upstream Pine Lake Downstream MPCA Standard (Min)
*MPCA standard 5 mg/L
50 100 150 200 250 300 350
Date
Lost River at Pine Lake ‐ E. coli
Upstream Downstream MPCA Standard (Max)
*MPCA standard 126 colonies per 100 mL
0.02 0.04 0.06 0.08 0.1 0.12 0.14 TP (mg/L) Date
Lost River and Pine Lake ‐ Total Phosphorus
Upstream Pine Lake Downstream MPCA Standard (Max)
*MPCA standard 0.06 mg/L
2 4 6 8 10 12 14 16 18 20 22 24 26 28 30 Turbidity (mg/L) Date
Lost River at Pine Lake ‐ Turbidity
Upstream Downstream MPCA Standard (Max)
*MPCA standard 25 NTU
Winterkill:
months would not impact winterkill. Water Clarity:
clarity and phytoplankton levels. Levels of algae are quite low for this particular lake.
would not alter any potential E. coli sources. Low Pipe Intake:
bottom of the water column to the extent
cleaned. Winterkill Raising the Pine Lake outlet elevation by 6 inches
Winterkill is a function of the volume of water and DO levels present at ice-up, oxygen-demanding sources under the ice (e.g. fish), oxygen- producing sources under the ice (e.g. phytoplankton), and light penetration through the ice to drive phytoplankton oxygen production.
Captured
Embankment Required
Impacted
Captured
Embankment Required
Impacted
Captured
Required
Impacted SIT E D SIT E E SIT E F
0.00 100.00 200.00 300.00 400.00 500.00 600.00 700.00 12‐Apr 17‐Apr 22‐Apr 27‐Apr 2‐May 7‐May 12‐May Discharge [CFS] Date
Pine Lake: Discharge at Outlet Structure
Alternate 2 Outlet with Select Impoundments: SMPE 100‐yr, 10 Day Runoff HEC‐RAS Results
Existing Outlet with no Impoundment Alt 2 Outlet with Site D Alt 2 Outlet with Site E Alt 2 Outlet with Site F
SITE D EXISTING OUTLET, NO IMPOUNDMENTS SITE F SITE E
Peak Dischar ge (CFS) Approx . FDR Value (AC-FT) Existi ng 556 N/A Site D 395 2,839
CLOSE GATE (1284.10) OPEN GATE (1283.50)
1,282.0 1,282.5 1,283.0 1,283.5 1,284.0 1,284.5 1,285.0 1,285.5 1,286.0 1,286.5 1,287.0 12‐Apr 17‐Apr 22‐Apr 27‐Apr 2‐May 7‐May 12‐May Pine Lake WSE [FT‐NGVD29] Date
Pine Lake: Water Surface Elevation
Alternate 2 Outlet with Select Impoundments: SMPE 100‐yr, 10 Day Runoff HEC‐RAS Results
Existing Outlet with no Impoundment Alt 2 Outlet with Site D Alt 2 Outlet with Site E Alt 2 Outlet with Site F Minor Flooding Major Flooding
SITE D EXISTING OUTLET, NO IMPOUNDMENTS SITE F SITE E CLOSE GATE (1284.10) OPEN GATE (1283.50)
Peak WSE (FT) Differe nce (FT) Existi ng 1286.27 N/A Site D 1285.76
feet at the top of the stop logs
the low flow outlet – 1282.6 in 2013
Lake outlet Low flow weir Stop logs Bottom elev. 1281.5
Sportsman Dr Highway 7
Potential Flood Impact
elevation of 1284.4 feet.
exceeds 1284.0 feet
Lake outlet
Sportsman Dr Highway 7
Potential Flood Impact
elevation of 1285.4 feet.
public access to lake is flooded
Lake outlet
Sportsman Dr Highway 7
Potential Flood Impact
elevation of 52 cabins
elevations of 22 cabins
Lake outlet
Sportsman Dr Highway 7